COVID-19
Re: COVID-19
How not to fit datapoints to time series (REACT) - thrid time

Re: COVID-19
Have you considered stupidity as an explanation

Re: COVID-19
It's pretty amazingly stupid.PeteB wrote: ↑Thu Oct 29, 2020 7:56 amHow not to fit datapoints to time series (REACT) - thrid time
It's as stupid as that person who took a two hour segment of the 538 time series, drew a line through it and concluded Trump would be +29 on election day. If you ignore data around your time period you are throwing away most of the picture.
There are hints that R has fallen - e.g. Liverpool rates have come down since being in Tier 3, official cases have been flat.
Though this latest thing implies the Actual Cases to Official Tested Cases ratio has worsened from about 3x to about 4x - so the flatness of official cases has been an illusion.
 Awarded gold star 4 November 2021
Re: COVID-19
Regarding that Shag (dance) event held last month.
Over 12 people died and over 100 people have tested positive for COVID-19 [from this event alone]. And this is ONLY the tally of dancers, not family members, co-workers, neighbors, hotel staff, servers, etc.
Such a serious super-spreading event that it's made the news.
Over 12 people died and over 100 people have tested positive for COVID-19 [from this event alone]. And this is ONLY the tally of dancers, not family members, co-workers, neighbors, hotel staff, servers, etc.
Such a serious super-spreading event that it's made the news.
- 1.png (379.51 KiB) Viewed 3413 times
-
shpalman

- Princess POW
- Posts: 8341
- Joined: Mon Nov 11, 2019 12:53 pm
- Location: One step beyond
- Contact:
Re: COVID-19
That's the one which said "Tourism is the life blood, so I'm not surprised the SC & Doc issued the exemption for more than 1500 dancers" and "It’s hard to believe that so many Dancers have Covid-19 after going to a Dance Event"?
Who would have guessed that lots of people would catch a aerosol- and contact-contagious disease from each other in an event characterized by physical exertion and close contact! Even after they had been given an exemption!
Who would have guessed that lots of people would catch a aerosol- and contact-contagious disease from each other in an event characterized by physical exertion and close contact! Even after they had been given an exemption!
having that swing is a necessary but not sufficient condition for it meaning a thing
@shpalman@mastodon.me.uk
@shpalman@mastodon.me.uk
Re: COVID-19
Crazy isn't it?shpalman wrote: ↑Thu Oct 29, 2020 11:10 amThat's the one which said "Tourism is the life blood, so I'm not surprised the SC & Doc issued the exemption for more than 1500 dancers" and "It’s hard to believe that so many Dancers have Covid-19 after going to a Dance Event"?
Who would have guessed that lots of people would catch a aerosol- and contact-contagious disease from each other in an event characterized by physical exertion and close contact! Even after they had been given an exemption!
-
Woodchopper

- Princess POW
- Posts: 7163
- Joined: Sat Oct 12, 2019 9:05 am
Re: COVID-19
The best summary I’ve seen of the medical research on what activities and environments are more or less safe.
https://english.elpais.com/society/2020 ... e-air.html
https://english.elpais.com/society/2020 ... e-air.html
-
discovolante

- Stummy Beige
- Posts: 4117
- Joined: Fri Oct 11, 2019 5:10 pm
Re: COVID-19
I saw that earlier. Senor von Late is teaching in person next Saturday. Bets on that the desks will be wiped down but all the doors and windows will be shut.Woodchopper wrote: ↑Thu Oct 29, 2020 4:10 pmThe best summary I’ve seen of the medical research on what activities and environments are more or less safe.
https://english.elpais.com/society/2020 ... e-air.html
To defy the laws of tradition is a crusade only of the brave.
Re: COVID-19
Ha I had done the same for the deaths The title is wrong, it's 7day rolling deathsEl Pollo Diablo wrote: ↑Wed Oct 28, 2020 11:15 amDaily Covid deaths weekly moving average since 1st Sept.png
Such a beautifully exponential curve.
We'll be at 1,000 deaths a day (MWA) by the 19th November at this rate - sooner, in reality, because we're on the upward part of the lognormal time series and so reporting is lagging deaths.
And 25,000 people in hospital won't be reached by "the end of November", but by the 12th/13th November, at the current doubling rate (13 days).
Covid UK Hospital Patient Numbers since 1_9_2020 (1).png
(Also a beautifully exponential curve).
- Screenshot 2020-10-29 174251.png (40.82 KiB) Viewed 3315 times
- and in fact hospitalisations ( you can get data for the EU and UK from https://www.ecdc.europa.eu/en/publicati ... y-covid-19
It still feels wrong not using log scales for such data.
Have you considered stupidity as an explanation
Re: COVID-19
Regressions ln(y) v. date, data 26/9 to 30/9
y = Cases by report date
doubling time 17.1 days
slope intercept
est 0.0404 -1,775
se 0.0043 189
Rsq 72.9% 0.256 se y
---------------------
y = Patients in hospital
doubling time 12.36 days
slope intercept
est 0.0561 -2,465.94
se 0.0005 22.28
Rsq 99.6% 0.0500 se y
------------------
y = deaths by publish date
doubling time 10.51 days
slope intercept
est 0.0659 -2,903.89
se 0.0046 202.17
Rsq 81.5% 0.4537 se y
----------------------
As we expect deaths to lag patients to lag cases, does that sequence of doubling times suggest that rate of increase has reduced over the past few weeks?
Re: COVID-19
It looks as though it might be slowing down. Or settling at a new slower exponential rate, possibly - hard to tellKAJ wrote: ↑Fri Oct 30, 2020 7:48 pmRegressions ln(y) v. date, data 26/9 to 30/9
y = Cases by report date
doubling time 17.1 days
slope intercept
est 0.0404 -1,775
se 0.0043 189
Rsq 72.9% 0.256 se y
---------------------
y = Patients in hospital
doubling time 12.36 days
slope intercept
est 0.0561 -2,465.94
se 0.0005 22.28
Rsq 99.6% 0.0500 se y
------------------
y = deaths by publish date
doubling time 10.51 days
slope intercept
est 0.0659 -2,903.89
se 0.0046 202.17
Rsq 81.5% 0.4537 se y
----------------------
As we expect deaths to lag patients to lag cases, does that sequence of doubling times suggest that rate of increase has reduced over the past few weeks?
- Screenshot 2020-10-30 204232.png (53.05 KiB) Viewed 3200 times
Have you considered stupidity as an explanation
Re: COVID-19
So, another national lockdown for England.
As per March, but with nurseries/schools/unis open.
And not till after a few days of dithering either.
Can't be arsed right now to work out how many weeks too late this is. After Germany, before France, dunno compared to Ireland and Belgium.
As per March, but with nurseries/schools/unis open.
And not till after a few days of dithering either.
Can't be arsed right now to work out how many weeks too late this is. After Germany, before France, dunno compared to Ireland and Belgium.
Awarded gold star 4 November 2021
Re: COVID-19
It is always going to be a few days, because changing the law takes time.lpm wrote: ↑Fri Oct 30, 2020 10:30 pmSo, another national lockdown for England.
As per March, but with nurseries/schools/unis open.
And not till after a few days of dithering either.
Can't be arsed right now to work out how many weeks too late this is. After Germany, before France, dunno compared to Ireland and Belgium.
where once I used to scintillate
now I sin till ten past three
now I sin till ten past three
-
Bird on a Fire

- Princess POW
- Posts: 10142
- Joined: Fri Oct 11, 2019 5:05 pm
- Location: Portugal
Re: COVID-19
It's interesting that the most reliable data - hospitalisations - also has a near-perfect exponential fit based on R^2, with the more methodologically-inadequate numbers fitting more loosely.jimbob wrote: ↑Fri Oct 30, 2020 8:45 pmIt looks as though it might be slowing down. Or settling at a new slower exponential rate, possibly - hard to tellKAJ wrote: ↑Fri Oct 30, 2020 7:48 pmRegressions ln(y) v. date, data 26/9 to 30/9
y = Cases by report date
doubling time 17.1 days
slope intercept
est 0.0404 -1,775
se 0.0043 189
Rsq 72.9% 0.256 se y
---------------------
y = Patients in hospital
doubling time 12.36 days
slope intercept
est 0.0561 -2,465.94
se 0.0005 22.28
Rsq 99.6% 0.0500 se y
------------------
y = deaths by publish date
doubling time 10.51 days
slope intercept
est 0.0659 -2,903.89
se 0.0046 202.17
Rsq 81.5% 0.4537 se y
----------------------
As we expect deaths to lag patients to lag cases, does that sequence of doubling times suggest that rate of increase has reduced over the past few weeks?
Screenshot 2020-10-30 204232.png
Or as the positivity rate is still increasing, that could just bee an artefact of the testing getting overwhelmed.
Assuming no change in hospitalisation rates that's the number I'd bet money on.
We have the right to a clean, healthy, sustainable environment.
-
discovolante
- Stummy Beige
- Posts: 4117
- Joined: Fri Oct 11, 2019 5:10 pm
Re: COVID-19
So, in Scotland - where we've had a sort of half-arsed semi 'circuit breaker' for the past couple of weeks, it seems the rate of infection at least might not be increasing?
https://twitter.com/TravellingTabby/sta ... 1436191744
'Over 25,000 tests were reported today, which is the most in quite a while. That caused the number of new cases to go up, but the positivity rate is down to 6%, which is the lowest in 3 weeks'
(below from this person's tracker: https://www.travellingtabby.com/scotlan ... s-tracker/ - as opposed to the Scotland interactive dashboard which is here: https://public.tableau.com/profile/phs. ... 0/Overview )
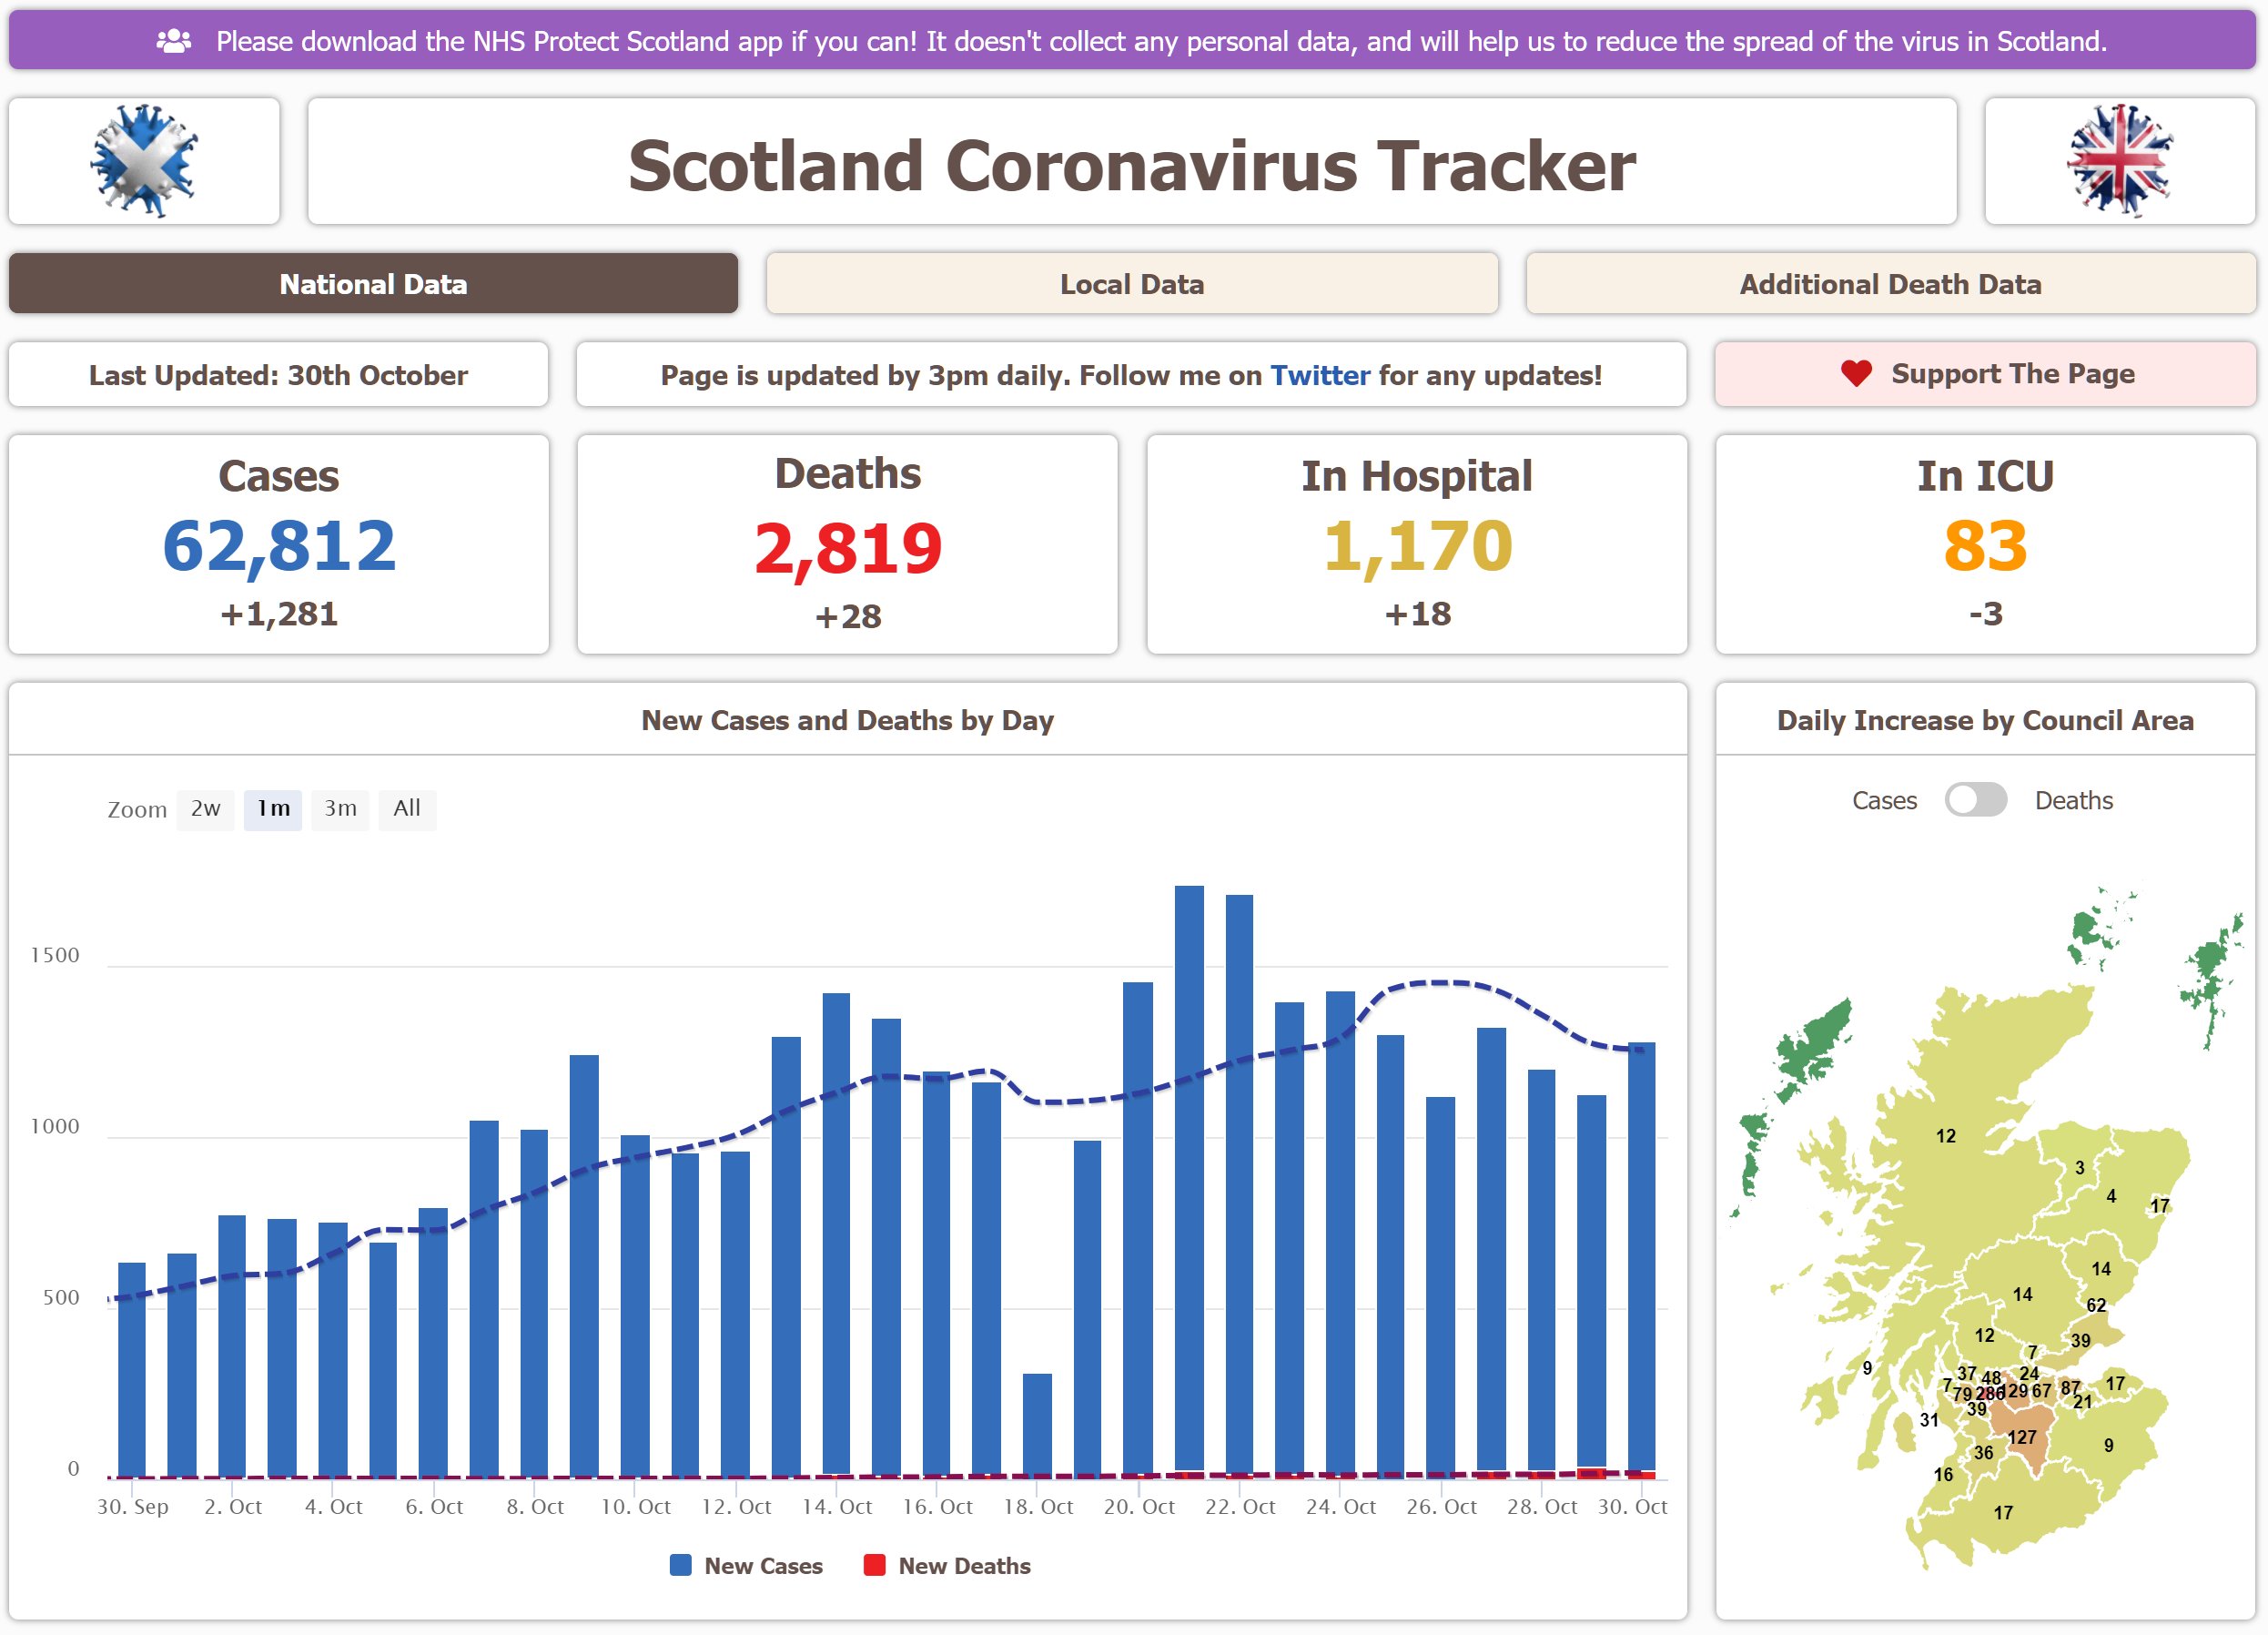
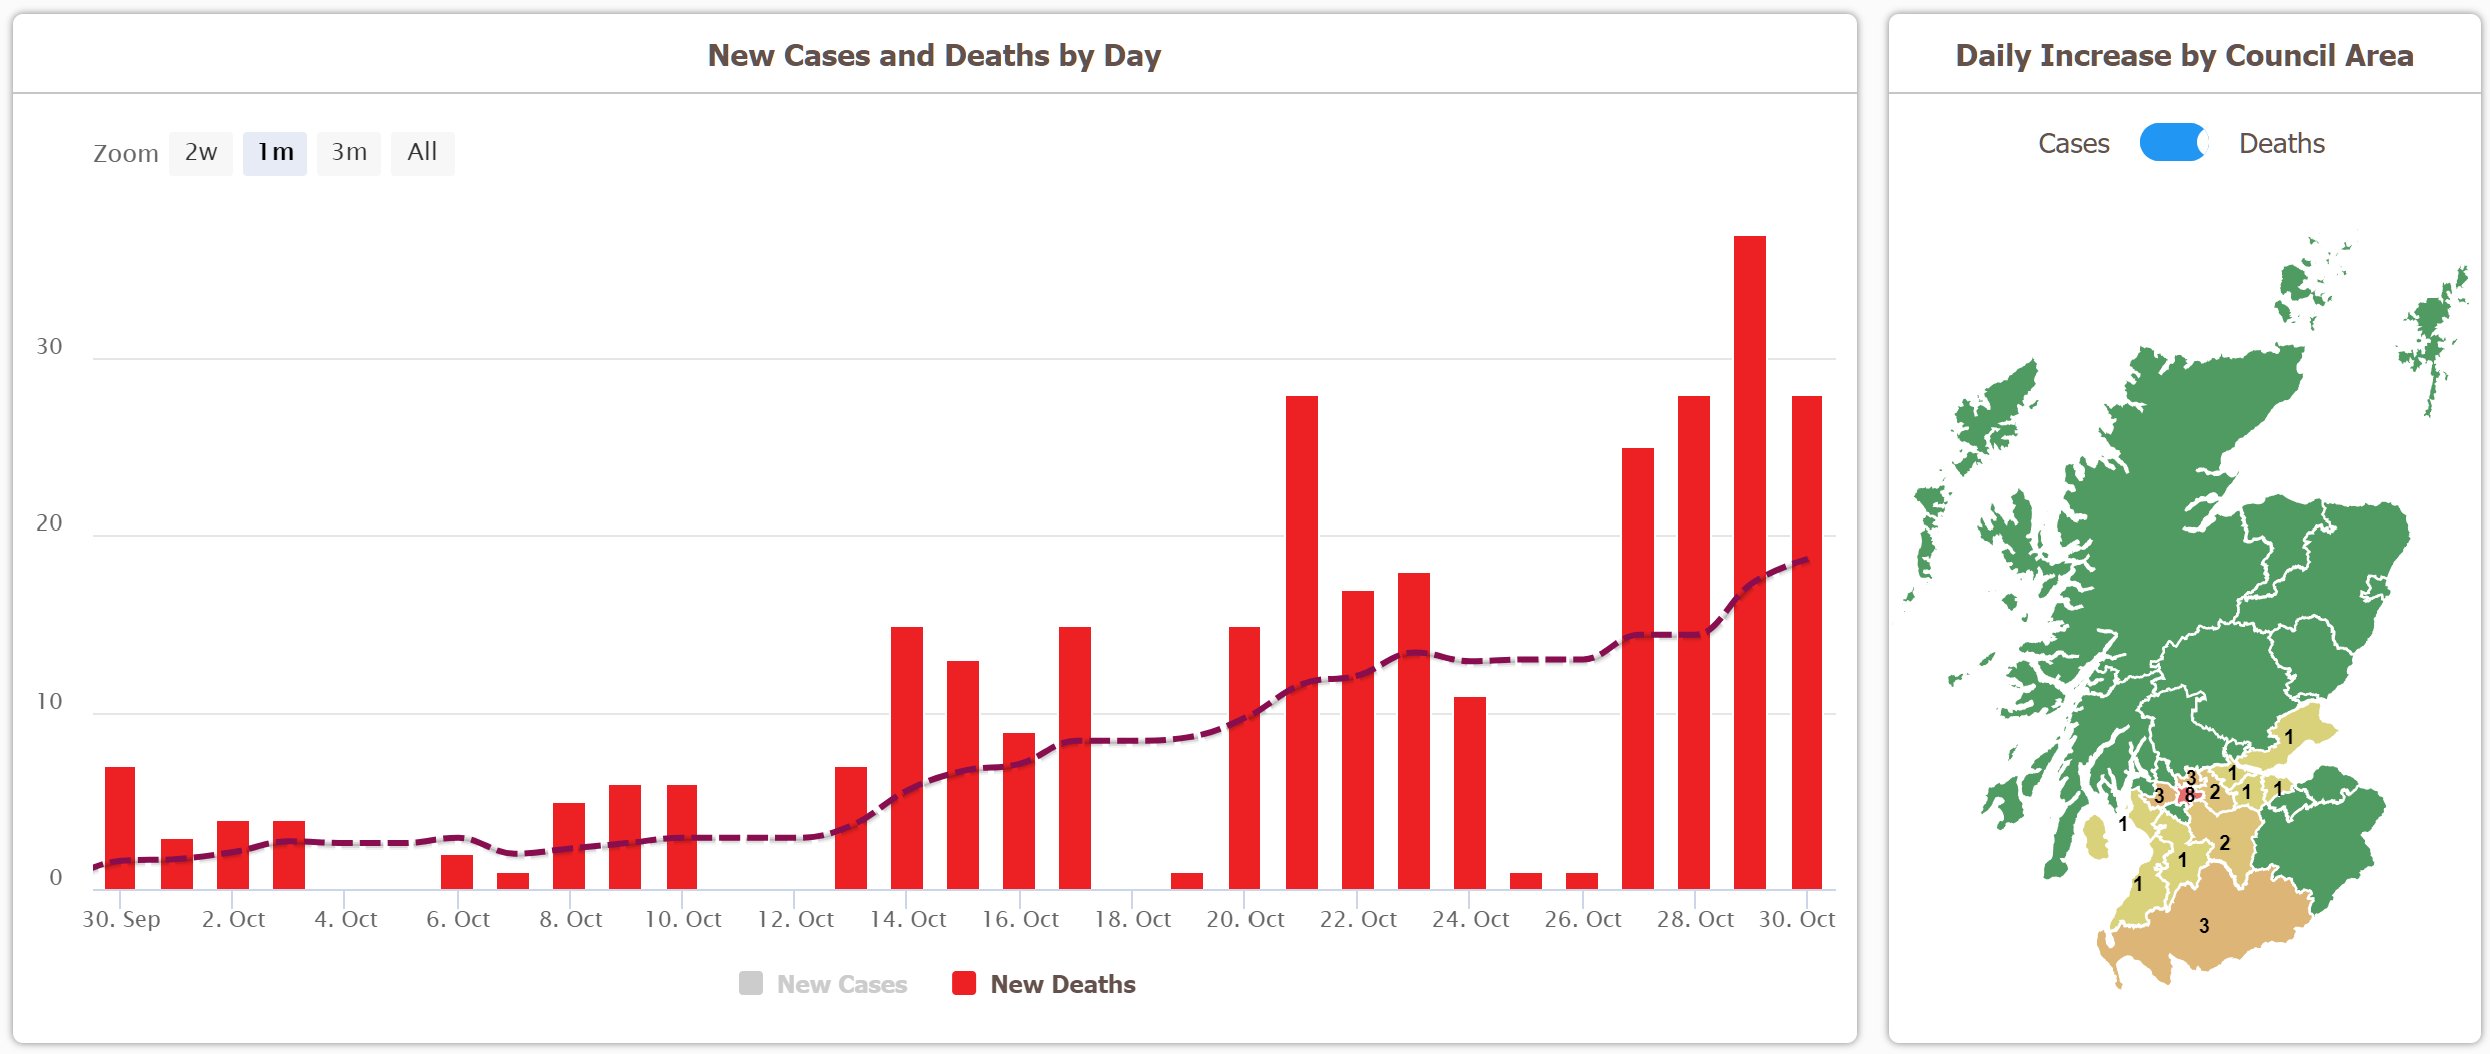
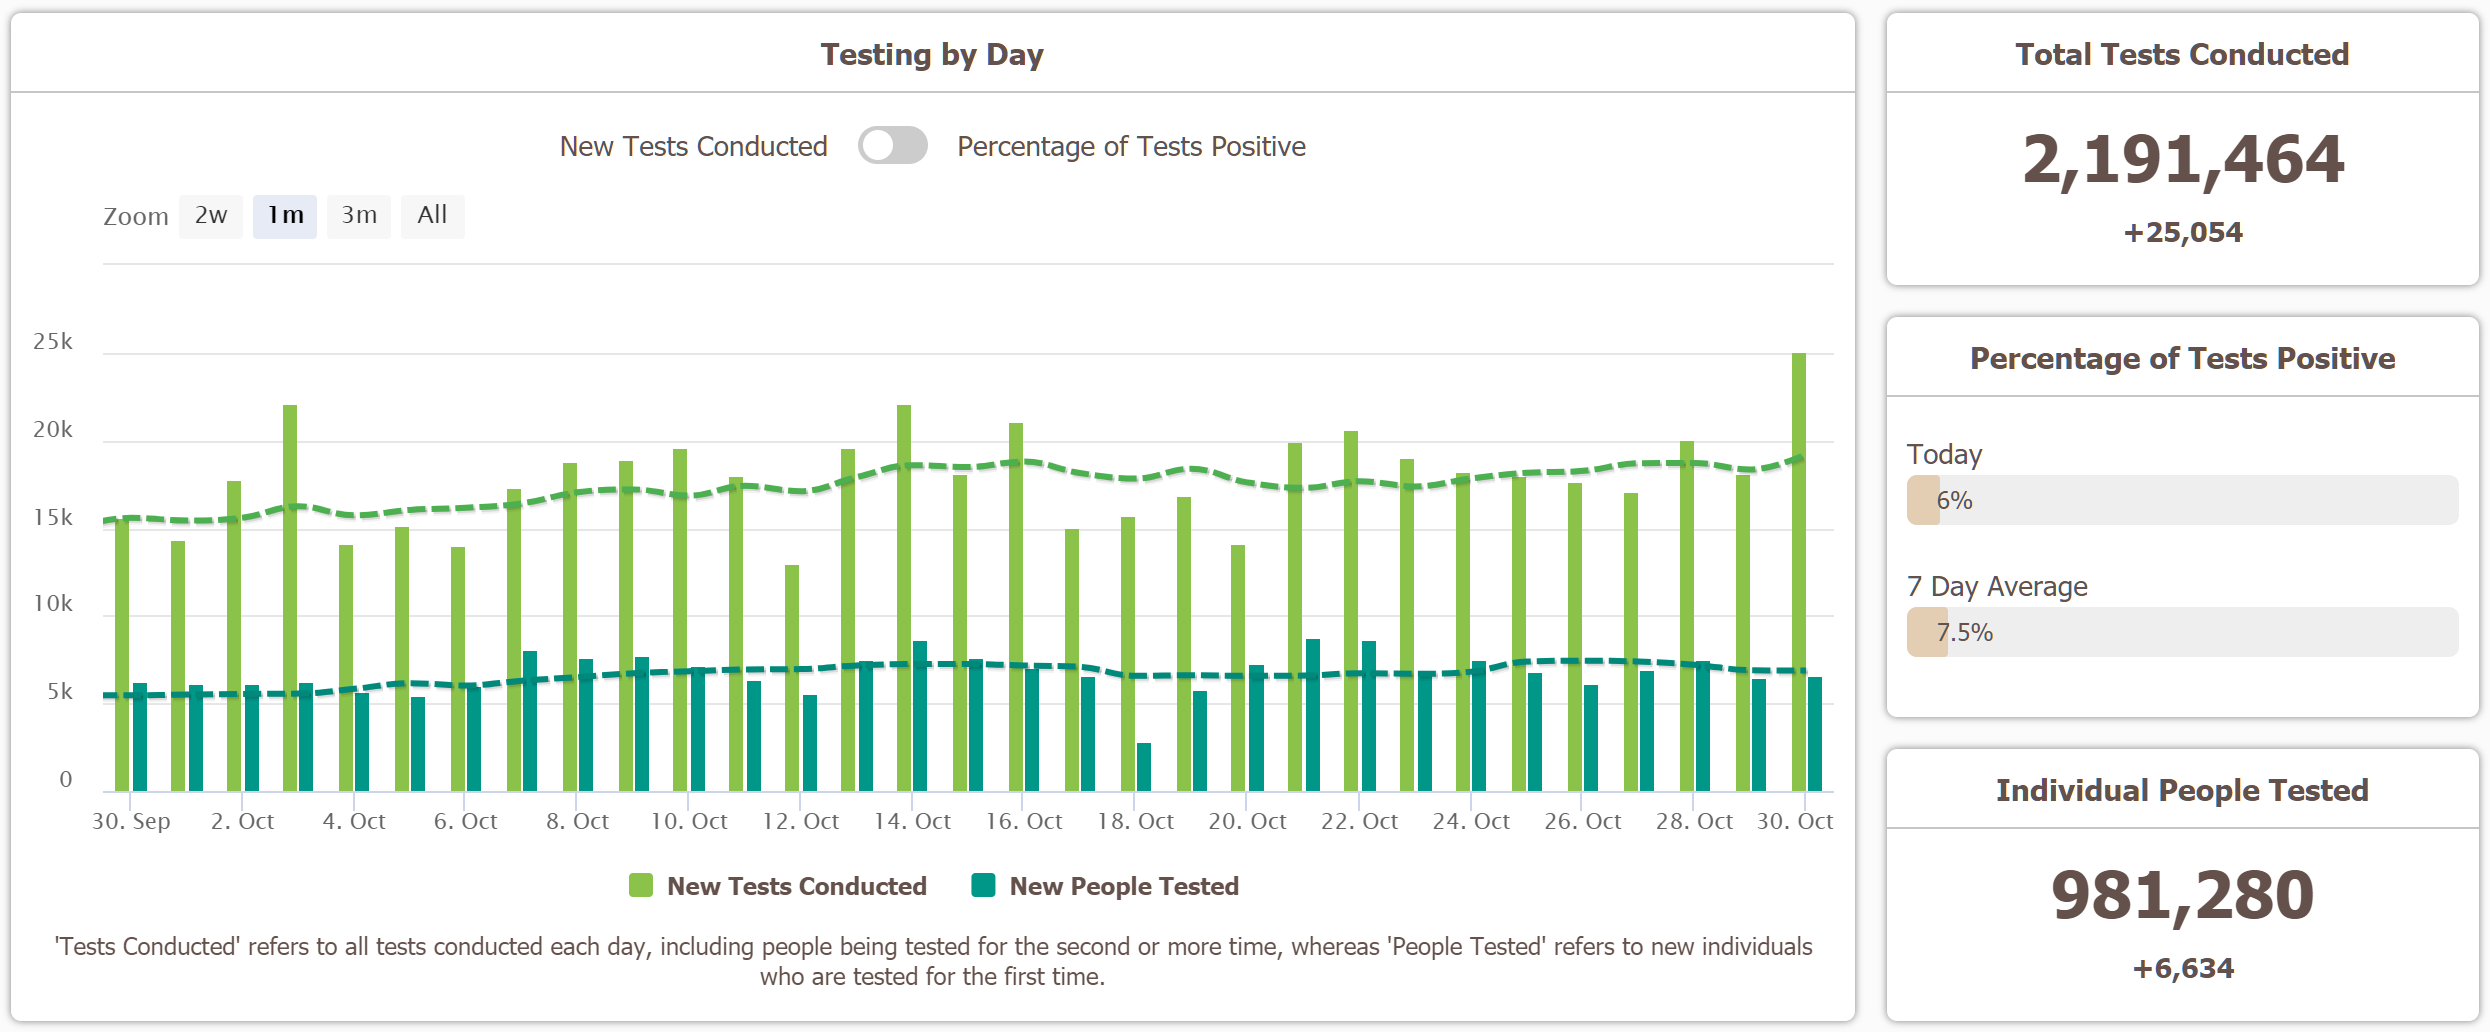
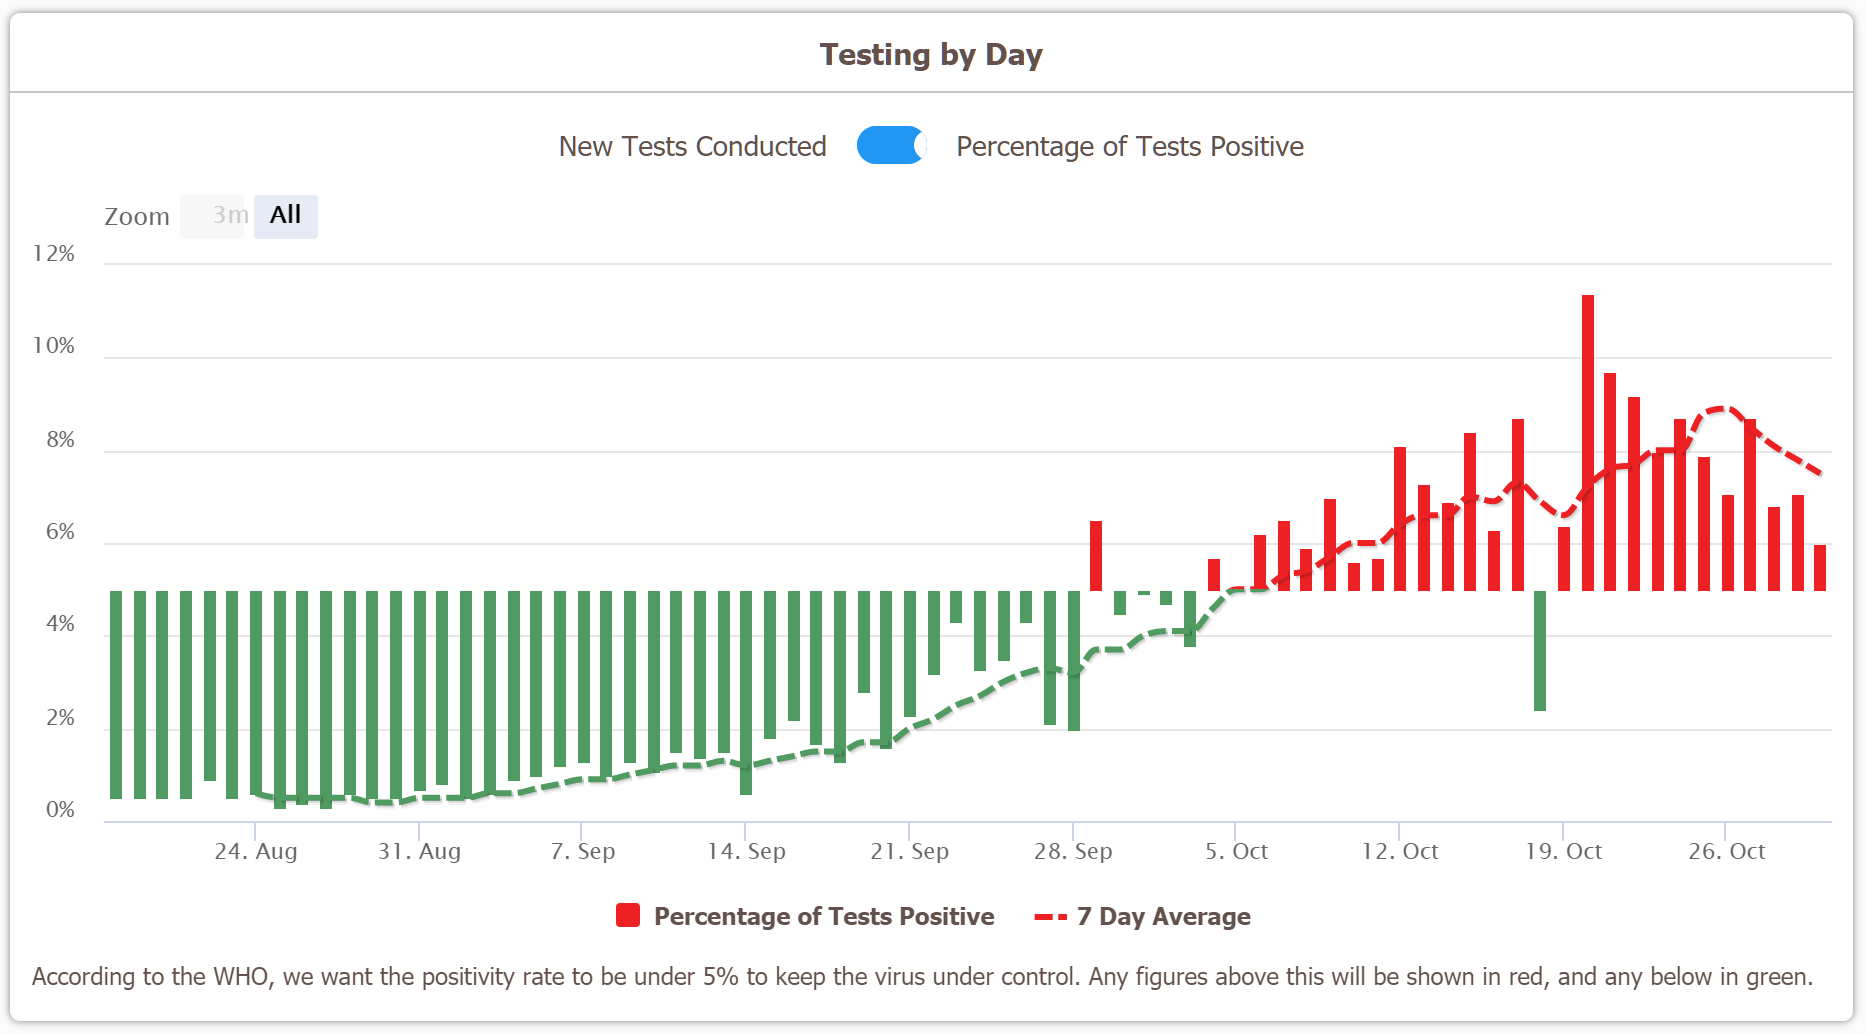
I mean, it's not exactly a rosy picture but it does look a bit teeny tiny marginally better (which is a pretty low bar), am I right/wrong?
We are being put into 'levels' on Monday, which I think for about 2/3 of local authorities means staying about the same as we are now, and everywhere else getting less restriction. I have no idea how that converts to population but presumably more than 2/3 of the population is going to be staying the same, which will now be level 3.
If anyone better at analysing this stuff has anything to say, be my guest.
https://twitter.com/TravellingTabby/sta ... 1436191744
'Over 25,000 tests were reported today, which is the most in quite a while. That caused the number of new cases to go up, but the positivity rate is down to 6%, which is the lowest in 3 weeks'
(below from this person's tracker: https://www.travellingtabby.com/scotlan ... s-tracker/ - as opposed to the Scotland interactive dashboard which is here: https://public.tableau.com/profile/phs. ... 0/Overview )
I mean, it's not exactly a rosy picture but it does look a bit teeny tiny marginally better (which is a pretty low bar), am I right/wrong?
We are being put into 'levels' on Monday, which I think for about 2/3 of local authorities means staying about the same as we are now, and everywhere else getting less restriction. I have no idea how that converts to population but presumably more than 2/3 of the population is going to be staying the same, which will now be level 3.
If anyone better at analysing this stuff has anything to say, be my guest.
To defy the laws of tradition is a crusade only of the brave.
Re: COVID-19
Cases by specimen date is more meaningful than by report date. Using data 21/9 - 25/10 (later results may not be reported yet) and applying a simple day-of-week correction the R^2 is 86% and doubling time 17.9 days.Bird on a Fire wrote: ↑Sat Oct 31, 2020 3:09 amIt's interesting that the most reliable data - hospitalisations - also has a near-perfect exponential fit based on R^2, with the more methodologically-inadequate numbers fitting more loosely.jimbob wrote: ↑Fri Oct 30, 2020 8:45 pmIt looks as though it might be slowing down. Or settling at a new slower exponential rate, possibly - hard to tellKAJ wrote: ↑Fri Oct 30, 2020 7:48 pmRegressions ln(y) v. date, data 26/9 to 30/9
y = Cases by report date
doubling time 17.1 days
slope intercept
est 0.0404 -1,775
se 0.0043 189
Rsq 72.9% 0.256 se y
---------------------
y = Patients in hospital
doubling time 12.36 days
slope intercept
est 0.0561 -2,465.94
se 0.0005 22.28
Rsq 99.6% 0.0500 se y
------------------
y = deaths by publish date
doubling time 10.51 days
slope intercept
est 0.0659 -2,903.89
se 0.0046 202.17
Rsq 81.5% 0.4537 se y
----------------------
As we expect deaths to lag patients to lag cases, does that sequence of doubling times suggest that rate of increase has reduced over the past few weeks?
Screenshot 2020-10-30 204232.png
Or as the positivity rate is still increasing, that could just bee an artefact of the testing getting overwhelmed.
Assuming no change in hospitalisation rates that's the number I'd bet money on.
Re: COVID-19
Indeed. It's why I like the covid.joinzoe.com symptomatic data report. As it isn't limited by testing numbers. Serological survey results should be pretty decent now as well. You don't need too large a sample size anymore.Bird on a Fire wrote: ↑Sat Oct 31, 2020 3:09 amIt's interesting that the most reliable data - hospitalisations - also has a near-perfect exponential fit based on R^2, with the more methodologically-inadequate numbers fitting more loosely.jimbob wrote: ↑Fri Oct 30, 2020 8:45 pmIt looks as though it might be slowing down. Or settling at a new slower exponential rate, possibly - hard to tellKAJ wrote: ↑Fri Oct 30, 2020 7:48 pmRegressions ln(y) v. date, data 26/9 to 30/9
y = Cases by report date
doubling time 17.1 days
slope intercept
est 0.0404 -1,775
se 0.0043 189
Rsq 72.9% 0.256 se y
---------------------
y = Patients in hospital
doubling time 12.36 days
slope intercept
est 0.0561 -2,465.94
se 0.0005 22.28
Rsq 99.6% 0.0500 se y
------------------
y = deaths by publish date
doubling time 10.51 days
slope intercept
est 0.0659 -2,903.89
se 0.0046 202.17
Rsq 81.5% 0.4537 se y
----------------------
As we expect deaths to lag patients to lag cases, does that sequence of doubling times suggest that rate of increase has reduced over the past few weeks?
Screenshot 2020-10-30 204232.png
Or as the positivity rate is still increasing, that could just bee an artefact of the testing getting overwhelmed.
Assuming no change in hospitalisation rates that's the number I'd bet money on.
Have you considered stupidity as an explanation
-
Bird on a Fire
- Princess POW
- Posts: 10142
- Joined: Fri Oct 11, 2019 5:05 pm
- Location: Portugal
Re: COVID-19
I think the issue is the limitations on test availability. As the number of cases goes up, the proportion of infected people able to get a test likely goes down.KAJ wrote: ↑Sat Oct 31, 2020 10:28 amCases by specimen date is more meaningful than by report date. Using data 21/9 - 25/10 (later results may not be reported yet) and applying a simple day-of-week correction the R^2 is 86% and doubling time 17.9 days.Bird on a Fire wrote: ↑Sat Oct 31, 2020 3:09 amIt's interesting that the most reliable data - hospitalisations - also has a near-perfect exponential fit based on R^2, with the more methodologically-inadequate numbers fitting more loosely.jimbob wrote: ↑Fri Oct 30, 2020 8:45 pm
It looks as though it might be slowing down. Or settling at a new slower exponential rate, possibly - hard to tell
Screenshot 2020-10-30 204232.png
Or as the positivity rate is still increasing, that could just bee an artefact of the testing getting overwhelmed.
Assuming no change in hospitalisation rates that's the number I'd bet money on.
There isn't (yet) the same limitation on hospitalisation, so the proportion of cases serious enough to be hospitalised should be constant.
I'm not even sure which data is more responsive to infection levels. It can take a few days from the emergence of symptoms to get a test result. How long does it take to go from first symptoms to hospitalisation?
We have the right to a clean, healthy, sustainable environment.
Re: COVID-19
That's only true if the age profile of infections is constant. But wasn't it more common in younger people back in September, and has spread to older cohorts since?Bird on a Fire wrote: ↑Sat Oct 31, 2020 12:17 pm
There isn't (yet) the same limitation on hospitalisation, so the proportion of cases serious enough to be hospitalised should be constant.
-
Bird on a Fire
- Princess POW
- Posts: 10142
- Joined: Fri Oct 11, 2019 5:05 pm
- Location: Portugal
Re: COVID-19
Yes, the Zoe study is useful. Their graph seems to show a steady increase in cases so far.jimbob wrote: ↑Sat Oct 31, 2020 10:56 amIndeed. It's why I like the covid.joinzoe.com symptomatic data report. As it isn't limited by testing numbers. Serological survey results should be pretty decent now as well. You don't need too large a sample size anymore.Bird on a Fire wrote: ↑Sat Oct 31, 2020 3:09 amIt's interesting that the most reliable data - hospitalisations - also has a near-perfect exponential fit based on R^2, with the more methodologically-inadequate numbers fitting more loosely.jimbob wrote: ↑Fri Oct 30, 2020 8:45 pm
It looks as though it might be slowing down. Or settling at a new slower exponential rate, possibly - hard to tell
Screenshot 2020-10-30 204232.png
Or as the positivity rate is still increasing, that could just bee an artefact of the testing getting overwhelmed.
Assuming no change in hospitalisation rates that's the number I'd bet money on.
It would be handy if they were also asking questions about testing, though - have you tried to get a test? did you manage to? what was the result? - to get a better handle on what the test data means, but I can understand why they're not doing that.
We have the right to a clean, healthy, sustainable environment.
-
Bird on a Fire
- Princess POW
- Posts: 10142
- Joined: Fri Oct 11, 2019 5:05 pm
- Location: Portugal
Re: COVID-19
Yes, true. We could be seeing an increase in community spread, after the initial boost from opening schools and universities.AMS wrote: ↑Sat Oct 31, 2020 12:23 pmThat's only true if the age profile of infections is constant. But wasn't it more common in younger people back in September, and has spread to older cohorts since?Bird on a Fire wrote: ↑Sat Oct 31, 2020 12:17 pm
There isn't (yet) the same limitation on hospitalisation, so the proportion of cases serious enough to be hospitalised should be constant.
We have the right to a clean, healthy, sustainable environment.

Re: COVID-19
Our area went into Tier 3 lockdown a week ago.
Zoe data estimates that infections have started falling - only 3 days so far, but fingers crossed.
Zoe data estimates that infections have started falling - only 3 days so far, but fingers crossed.
- ReactNative-snapshot-image1662261956067888159.jpg (33.44 KiB) Viewed 2994 times
My avatar was a scientific result that was later found to be 'mistaken' - I rarely claim to be 100% correct
ETA 5/8/20: I've been advised that the result was correct, it was the initial interpretation that needed to be withdrawn
Meta? I'd say so!
ETA 5/8/20: I've been advised that the result was correct, it was the initial interpretation that needed to be withdrawn
Meta? I'd say so!
Re: COVID-19
You'd think a government might expect the need for tests to go up when infections go up.
And, you know, plan for it.
The correct approach would be to have huge capacity during the summer lull that was used for surveys of entire towns - test 500,000 people and study exactly what the case distribution is. Or test every child in the week before schools go back. And then expand capacity further during waves to always keep ahead. If you're not wandering high streets asking passersby if they want a test going spare, you're not doing it right.
Evidence seems to indicate that Leicester/Tier 3 etc brings about an initial dip in cases. But as the weeks pass it never gets down properly and starts to go up again. Liverpool is going downwards at the moment.
Awarded gold star 4 November 2021-
discovolante
- Stummy Beige
- Posts: 4117
- Joined: Fri Oct 11, 2019 5:10 pm
Re: COVID-19
Lol. There are countless ways this could have been done better, and the government has done none of them.
To defy the laws of tradition is a crusade only of the brave.
-
sTeamTraen

- After Pie
- Posts: 2559
- Joined: Mon Nov 11, 2019 4:24 pm
- Location: Palma de Mallorca, Spain
Re: COVID-19
Belgium's new lockdown starts this coming Monday. Ireland's is already underway, I think.
Something something hammer something something nail