Page 2 of 4
Re: Bad Graphs
Posted: Thu Jan 20, 2022 7:05 pm
by Brightonian
The Guardian's criticising this pork pie chart made by the Sun's boffins:

Also referencing Twitter account
@graphcrimes which I hadn't come across.
Re: Bad Graphs
Posted: Thu Jan 20, 2022 11:24 pm
by WFJ
Mustard with a pork pie? Chutney or onion relish surely.
Re: Bad Graphs
Posted: Fri Jan 21, 2022 10:08 am
by Rich Scopie
WFJ wrote: ↑Thu Jan 20, 2022 11:24 pm
Mustard with a pork pie? Chutney or onion relish surely.
Mushy peas. Every time. (Mint sauce optional.)
Re: Bad Graphs
Posted: Fri Jan 21, 2022 2:06 pm
by monkey
I like mustard wit a pork pie.
Re: Bad Graphs
Posted: Fri Jan 21, 2022 3:55 pm
by nekomatic
I prefer it without one.
Quite a volte face for the Sun to acknowledge that a giant porky pie is a suitable metaphor for Boris Johnson’s premiership though.
Re: Bad Graphs
Posted: Fri Jan 21, 2022 4:14 pm
by dyqik
nekomatic wrote: ↑Fri Jan 21, 2022 3:55 pm
I prefer it without one.
Quite a
volte face for the
Sun to acknowledge that a giant porky pie is a suitable metaphor for Boris Johnson’s premiership though.
A liberal dose of mustard, chutney etc. is probably only way most people could swallow Johnson's pork pies.
The exceptions being most UK newspaper editors.
Re: Bad Graphs
Posted: Mon Jan 31, 2022 6:07 pm
by dyqik
Not strictly speaking a bad graph, but I do feel that the formatting of the Y-axis units could confuse the reader.
Re: Bad Graphs
Posted: Mon Jan 31, 2022 6:25 pm
by basementer
dyqik wrote: ↑Mon Jan 31, 2022 6:07 pm
Not strictly speaking a bad graph, but I do feel that the formatting of the Y-axis units could confuse the reader.
Brilliant.
Re: Bad Graphs
Posted: Mon Jan 31, 2022 8:00 pm
by Sciolus
Once, or twice for some Christians.
Re: Bad Graphs
Posted: Mon Jan 31, 2022 8:05 pm
by dyqik
Sciolus wrote: ↑Mon Jan 31, 2022 8:00 pm
Once, or twice for some Christians.
Arguably, many babies aren't named until after they are born, either informally, and definitely formally when the birth is registered or they are christened.
So the number of babies born while named Miles will be somewhat less than the number of people called Miles.
Re: Bad Graphs
Posted: Mon Jan 31, 2022 8:11 pm
by shpalman
dyqik wrote: ↑Mon Jan 31, 2022 8:05 pm
Sciolus wrote: ↑Mon Jan 31, 2022 8:00 pm
Once, or twice for some Christians.
Arguably, many babies aren't named until after they are born, either informally, and definitely formally when the birth is registered or they are christened.
So the number of babies born while named Miles will be somewhat less than the number of people called Miles.
Well YMMV.
Re: Bad Graphs
Posted: Mon Jan 31, 2022 9:14 pm
by jimbob
shpalman wrote: ↑Mon Jan 31, 2022 8:11 pm
dyqik wrote: ↑Mon Jan 31, 2022 8:05 pm
Sciolus wrote: ↑Mon Jan 31, 2022 8:00 pm
Once, or twice for some Christians.
Arguably, many babies aren't named until after they are born, either informally, and definitely formally when the birth is registered or they are christened.
So the number of babies born while named Miles will be somewhat less than the number of people called Miles.
Well YMMV.
Re: Bad Graphs
Posted: Mon Jan 31, 2022 9:35 pm
by monkey
shpalman wrote: ↑Mon Jan 31, 2022 8:11 pm
dyqik wrote: ↑Mon Jan 31, 2022 8:05 pm
Sciolus wrote: ↑Mon Jan 31, 2022 8:00 pm
Once, or twice for some Christians.
Arguably, many babies aren't named until after they are born, either informally, and definitely formally when the birth is registered or they are christened.
So the number of babies born while named Miles will be somewhat less than the number of people called Miles.
Well YMMV.
I was just trying to find the volume of a newborn so I could estimate Miles per gallon. I failed*.
I think you could do an estimate if you know the density of a baby, because weights are recorded. That's 1.06–1.07 g/cm^3 apparently. But then I stopped because I got distracted.
*Was planning on dividing the number of Mileses by the total volume of babies.
Re: Bad Graphs
Posted: Mon Jan 31, 2022 9:57 pm
by dyqik
monkey wrote: ↑Mon Jan 31, 2022 9:35 pm
I think you could do an estimate if you know the density of a baby, because weights are recorded. That's 1.06–1.07 g/cm^3 apparently.
And also the perfect opportunity to cite Nirvana's Nevermind.
Re: Bad Graphs
Posted: Tue Feb 01, 2022 12:25 am
by Banana
This
https://www.pedestrian.tv/news/newspoll ... -albanese/ is getting a lot of airtime in Australia this morning for being a very bad pie chart
edit: screwed the link
Re: Bad Graphs
Posted: Tue Feb 01, 2022 2:05 pm
by tom p
monkey wrote: ↑Mon Jan 31, 2022 9:35 pm
shpalman wrote: ↑Mon Jan 31, 2022 8:11 pm
dyqik wrote: ↑Mon Jan 31, 2022 8:05 pm
Arguably, many babies aren't named until after they are born, either informally, and definitely formally when the birth is registered or they are christened.
So the number of babies born while named Miles will be somewhat less than the number of people called Miles.
Well YMMV.
I was just trying to find the volume of a newborn so I could estimate Miles per gallon. I failed*.
I think you could do an estimate if you know the density of a baby, because weights are recorded. That's 1.06–1.07 g/cm^3 apparently. But then I stopped because I got distracted.
*Was planning on dividing the number of Mileses by the total volume of babies.
Typically a baby, crown-to-heel will be about 50cm.
Head circumference is ~35cm, and that's slightly more than the circumference of the torso.
Roughly speaking, if you were to cut off the arms and fix them to the pelvis, like the baby had 4 legs, then you'd have a sphere of circumference 35cm atop a cylinder of circumference 30cm & height 50cm.
Re: Bad Graphs
Posted: Tue Feb 01, 2022 4:11 pm
by bob sterman
monkey wrote: ↑Mon Jan 31, 2022 9:35 pm
I was just trying to find the volume of a newborn so I could estimate Miles per gallon. I failed*.
In contrast - I was looking to see
How often people called Miles play "Born in the USA"?
Miles Davis definitely did some sessions with Steven Van Zandt and The Boss - but so far I've found no conclusive evidence. Seems unlikely.
Re: Bad Graphs
Posted: Wed Feb 02, 2022 12:33 pm
by IvanV
monkey wrote: ↑Mon Jan 31, 2022 9:35 pm
I was just trying to find the volume of a newborn so I could estimate Miles per gallon. I failed*.
I think you could do an estimate if you know the density of a baby, because weights are recorded. That's 1.06–1.07 g/cm^3 apparently. But then I stopped because I got distracted.
*Was planning on dividing the number of Mileses by the total volume of babies.
Let me satisfy you.
Average baby mass around 3.5kg from US sources.
Density is about 1.03. So 3.4 litres, 0.76 UK gallons or 0.9 US gallons.
I differ from you on density. I see first google hit says 1.06-1.07 for the "FFM density", but FFM stands for Fat Free Mass. Did they boil down some babies to assess that? The actual density depends upon how much fat there is as a proportion of total body mass, which varies. But 1.03 is reported as an average in a paper that got it experimentally back in the 1960s.
What does density mean when we assess it for a human? Humans tend to float in water, when they aren't drowning, because they have some gas in their lungs, and other internal cavities which reduces the density of their overall body envelope to below 1. The 1.03 figure is presumably excluding that effect.
To calculate mpg we need to know the birthrate of total babies in the population of interest, as well as the (future) Miles.
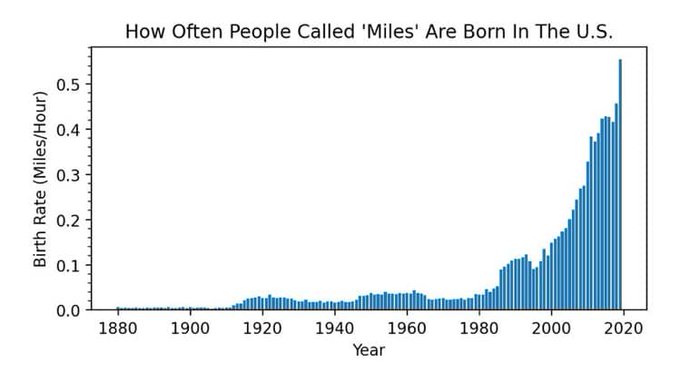
There are currently about 3.6 million babies per year in the US, or 3.23 million US gallons. Reading off the graph above, Miles are about 0.56 per hour or 4,900 per year.
That comes out to 0.0015 Miles per (US) gallon.
Re: Bad Graphs
Posted: Wed Feb 02, 2022 1:07 pm
by Nero
My first name is Myles. I think I might have just swerved the above.
Re: Bad Graphs
Posted: Wed Feb 02, 2022 3:46 pm
by monkey
IvanV wrote: ↑Wed Feb 02, 2022 12:33 pm
monkey wrote: ↑Mon Jan 31, 2022 9:35 pm
I was just trying to find the volume of a newborn so I could estimate Miles per gallon. I failed*.
I think you could do an estimate if you know the density of a baby, because weights are recorded. That's 1.06–1.07 g/cm^3 apparently. But then I stopped because I got distracted.
*Was planning on dividing the number of Mileses by the total volume of babies.
Let me satisfy you.
Average baby mass around 3.5kg from US sources.
Density is about 1.03. So 3.4 litres, 0.76 UK gallons or 0.9 US gallons.
I differ from you on density. I see first google hit says 1.06-1.07 for the "FFM density", but FFM stands for Fat Free Mass. Did they boil down some babies to assess that? The actual density depends upon how much fat there is as a proportion of total body mass, which varies. But 1.03 is reported as an average in a paper that got it experimentally back in the 1960s.
What does density mean when we assess it for a human? Humans tend to float in water, when they aren't drowning, because they have some gas in their lungs, and other internal cavities which reduces the density of their overall body envelope to below 1. The 1.03 figure is presumably excluding that effect.
To calculate mpg we need to know the birthrate of total babies in the population of interest, as well as the (future) Miles.
There are currently about 3.6 million babies per year in the US, or 3.23 million US gallons. Reading off the graph above, Miles are about 0.56 per hour or 4,900 per year.
That comes out to 0.0015 Miles per (US) gallon.
Awesome. Thank you very much.
Re: Bad Graphs
Posted: Wed Feb 02, 2022 4:17 pm
by shpalman
tom p wrote: ↑Tue Feb 01, 2022 2:05 pm
Roughly speaking, if you were to cut off the arms and fix them to the pelvis, like the baby had 4 legs, then you'd have a sphere of circumference 35cm atop a cylinder of circumference 30cm & height 50cm.
IvanV wrote: ↑Wed Feb 02, 2022 12:33 pm
I differ from you on density. I see first google hit says 1.06-1.07 for the "FFM density", but FFM stands for Fat Free Mass. Did they boil down some babies to assess that?
Ok then for how long in the oven?
Re: Bad Graphs
Posted: Wed Feb 02, 2022 4:34 pm
by tom p
shpalman wrote: ↑Wed Feb 02, 2022 4:17 pm
tom p wrote: ↑Tue Feb 01, 2022 2:05 pm
Roughly speaking, if you were to cut off the arms and fix them to the pelvis, like the baby had 4 legs, then you'd have a sphere of circumference 35cm atop a cylinder of circumference 30cm & height 50cm.
IvanV wrote: ↑Wed Feb 02, 2022 12:33 pm
I differ from you on density. I see first google hit says 1.06-1.07 for the "FFM density", but FFM stands for Fat Free Mass. Did they boil down some babies to assess that?
Ok then for how long in the oven?
At a standard 20mins for 450g + 20 mins @ 180c, you're looking at about 3 hours. Less for rare
Re: Bad Graphs
Posted: Wed Feb 02, 2022 4:51 pm
by shpalman
tom p wrote: ↑Wed Feb 02, 2022 4:34 pm
shpalman wrote: ↑Wed Feb 02, 2022 4:17 pm
tom p wrote: ↑Tue Feb 01, 2022 2:05 pm
Roughly speaking, if you were to cut off the arms and fix them to the pelvis, like the baby had 4 legs, then you'd have a sphere of circumference 35cm atop a cylinder of circumference 30cm & height 50cm.
IvanV wrote: ↑Wed Feb 02, 2022 12:33 pm
I differ from you on density. I see first google hit says 1.06-1.07 for the "FFM density", but FFM stands for Fat Free Mass. Did they boil down some babies to assess that?
Ok then for how long in the oven?
At a standard 20mins for 450g + 20 mins @ 180c, you're looking at about 3 hours. Less for rare
This is why people are always so f.cking obsessed with weights* of babies.
Re: Bad Graphs
Posted: Wed Feb 02, 2022 6:30 pm
by tom p
Exactly - nobody wants an overdone roast baby, after all
Re: Bad Graphs
Posted: Mon Mar 07, 2022 10:28 pm
by dyqik
Reddit's
Data Is Ugly sub is relevant for this thread.