Page 3 of 4
Re: Bad Graphs
Posted: Fri May 19, 2023 6:03 pm
by shpalman
https://twitter.com/ProfTimBale/status/ ... ytiZw&s=19
- 20230519_200221-01.jpeg (94.69 KiB) Viewed 1745 times
Re: Bad Graphs
Posted: Fri May 19, 2023 6:48 pm
by IvanV
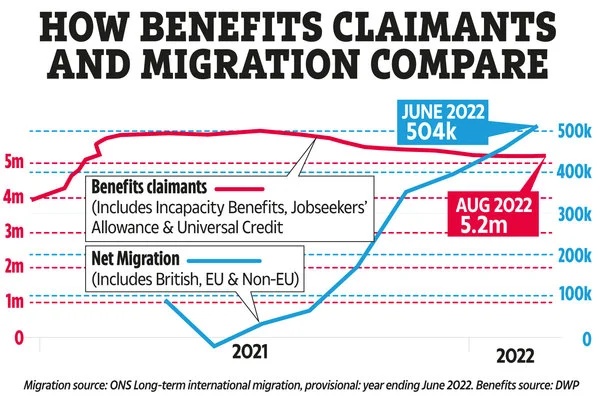
I saw a discussion of this graph somewhere else. It is supposed to be supporting an anti-immigration right-wing cause. They were trying to indicate that many migrants are getting benefits. And hence the need to have a proper hard right-winger in power rather than the present not-quite-hard-enough hard right wingers who have come into power.
What is ironic is - as Tim Bale signposts in a subsequent tweet- that it doesn't show that at all, whether you read the axes correctly or not. Benefits claimants are actually coming down as migration is recovering post-Covid.
The government was recently claiming it would get net immigration down to about 100,000. Though perhaps they can say that they meant per month.
Re: Bad Graphs
Posted: Fri May 19, 2023 7:02 pm
by jaap
IvanV wrote: ↑Fri May 19, 2023 6:48 pm
I saw a discussion of this graph somewhere else. It is supposed to be supporting an anti-immigration right-wing cause.
I just like the fact that the red line is not even a graph/function, seeing as it goes backwards for a bit.
Re: Bad Graphs
Posted: Fri May 19, 2023 7:07 pm
by monkey
jaap wrote: ↑Fri May 19, 2023 7:02 pm
IvanV wrote: ↑Fri May 19, 2023 6:48 pm
I saw a discussion of this graph somewhere else. It is supposed to be supporting an anti-immigration right-wing cause.
I just like the fact that the red line is not even a graph/function, seeing as it goes backwards for a bit.
Graphs and functions can do that. It's just a bit rare when the x-axis is time.
Re: Bad Graphs
Posted: Fri May 19, 2023 7:09 pm
by bjn
Dr Who is f.cking with the figures.
Re: Bad Graphs
Posted: Fri May 19, 2023 7:24 pm
by Opti
It's taken from a piece in The Sun written by the
Right Wing Fascist nutter of the moment, Douglas Murray. The piece talks about loadsa immigrants encouraging feckless 'indigenous' Brits to be benefit dossers.
It's a classic sh.t graph.
Re: Bad Graphs
Posted: Sun May 21, 2023 11:42 am
by IvanV
Opti wrote: ↑Fri May 19, 2023 7:24 pm
It's taken from a piece in The Sun written by the
Right Wing Fascist nutter of the moment, Douglas Murray. The piece talks about loadsa immigrants encouraging feckless 'indigenous' Brits to be benefit dossers.
It's a classic sh.t graph.
A lot of the benefit recipients included in the graph are people who are in work but on low wages. So that could be relieved if their wages went up substantially: that would be the only way of relieving it short of cutting their entitlement to benefits. Part of the upward pressure on wages at the moment is coming from the fact that we have substantially cut EU immigrants who might be willing to work for the wages offered. And probably benefit claimants have been coming down a bit because unemployment is low and wages have been responding to that upward pressure to some degree. But our right-wing government appears to advocate resistance to wage pressure, because of its inflationary effect.
I've just looked through the headlines of over 200 of the most recent articles on Douglas Murray's website, and only one article is about wages and incomes. Low incomes is not something he generally mentions. That one article advocates not giving in to strikers demanding higher wages, because it is not "fair" to the rest of us whose incomes are being eroded by inflation higher than wage increases. So presumably he isn't an advocate of reducing this "problem" of having many benefit recipients through higher wages for the lower paid.
Re: Bad Graphs
Posted: Sun May 21, 2023 12:00 pm
by Lew Dolby
IvanV wrote: ↑Sun May 21, 2023 11:42 am
But our right-wing government appears to advocate resistance to wage pressure, because of its inflationary effect.
which, in itself is b-sh.t. I keep challenging tory loadmoths round here to tell me which prices will go up is state school teachers or NHS nurses get a pay rise - and to explain the mechanism they think is in play.
Re: Bad Graphs
Posted: Sun May 21, 2023 1:39 pm
by IvanV
Lew Dolby wrote: ↑Sun May 21, 2023 12:00 pm
IvanV wrote: ↑Sun May 21, 2023 11:42 am
But our right-wing government appears to advocate resistance to wage pressure, because of its inflationary effect.
which, in itself is b-sh.t. I keep challenging tory loadmoths round here to tell me which prices will go up is state school teachers or NHS nurses get a pay rise - and to explain the mechanism they think is in play.
If they knew their classical economics, they might mention that one of the three classical causes of inflation in the Keynsian model is
demand-pull inflation, which can be caused by increased demand from people with more money to spend, while supply fails to increase in proportion.
Though, in the specific case you mention of public sector wage increases, if that is financed by public spending cuts elsewhere, then the effect on inflation might be broadly neutral, because of an offsetting demand reduction from those other public spending cuts. And also one should take into account their propensity to spend. Recently saving in the consumer sector has been growing, and not all additional income has been spent.
I'm entertained by your suggestion of loudmoths. A lovely idea for a fantasy novel.
Re: Bad Graphs
Posted: Sun May 21, 2023 2:03 pm
by EACLucifer
IvanV wrote: ↑Sun May 21, 2023 1:39 pm
Lew Dolby wrote: ↑Sun May 21, 2023 12:00 pm
IvanV wrote: ↑Sun May 21, 2023 11:42 am
But our right-wing government appears to advocate resistance to wage pressure, because of its inflationary effect.
which, in itself is b-sh.t. I keep challenging tory loadmoths round here to tell me which prices will go up is state school teachers or NHS nurses get a pay rise - and to explain the mechanism they think is in play.
If they knew their classical economics, they might mention that one of the three classical causes of inflation in the Keynsian model is
demand-pull inflation, which can be caused by increased demand from people with more money to spend, while supply fails to increase in proportion.
Though, in the specific case you mention of public sector wage increases, if that is financed by public spending cuts elsewhere, then the effect on inflation might be broadly neutral, because of an offsetting demand reduction from those other public spending cuts. And also one should take into account their propensity to spend. Recently saving in the consumer sector has been growing, and not all additional income has been spent.
I'm entertained by your suggestion of loudmoths. A lovely idea for a fantasy novel.
Presumably a loadmoth would look a little like a hawkmoth?
Re: Bad Graphs
Posted: Wed Aug 09, 2023 12:19 pm
by Holylol
Re: Bad Graphs
Posted: Wed Aug 09, 2023 1:40 pm
by dyqik
Holylol wrote: ↑Wed Aug 09, 2023 12:19 pm

There's not a graph in that image (apart from the % of the vote counted progress bar at the bottom right).
So many "bad graph" posts aren't intended to be graphs, and it's the poster interpreting graphics as a graph when it clearly isn't one.
Re: Bad Graphs
Posted: Wed Aug 09, 2023 2:10 pm
by Grumble
dyqik wrote: ↑Wed Aug 09, 2023 1:40 pm
Holylol wrote: ↑Wed Aug 09, 2023 12:19 pm
There's not a graph in that image (apart from the % of the vote counted progress bar at the bottom right).
So many "bad graph" posts aren't intended to be graphs, and it's the poster interpreting graphics as a graph when it clearly isn't one.
True, but fair to say it’s a bad graphic. If there was an equally sized cross in a box below the tick the confusion wouldn’t arise. Apart from the confusion of No having a tick and Yes having a cross.
Re: Bad Graphs
Posted: Wed Aug 09, 2023 2:21 pm
by bjn
Do bar charts, however bad, not count as graphs?
Re: Bad Graphs
Posted: Wed Aug 09, 2023 2:21 pm
by dyqik
Grumble wrote: ↑Wed Aug 09, 2023 2:10 pm
dyqik wrote: ↑Wed Aug 09, 2023 1:40 pm
Holylol wrote: ↑Wed Aug 09, 2023 12:19 pm
There's not a graph in that image (apart from the % of the vote counted progress bar at the bottom right).
So many "bad graph" posts aren't intended to be graphs, and it's the poster interpreting graphics as a graph when it clearly isn't one.
True, but fair to say it’s a bad graphic. If there was an equally sized cross in a box below the tick the confusion wouldn’t arise. Apart from the confusion of No having a tick and Yes having a cross.
This is the way all CNN election results graphics are done, though. So it's not like it's an unfamiliar graphic convention.
Re: Bad Graphs
Posted: Wed Aug 09, 2023 2:22 pm
by dyqik
bjn wrote: ↑Wed Aug 09, 2023 2:21 pm
Do bar charts, however bad, not count as graphs?
A bar chart does. It's a
graphical representation of numerical data, where the geometry of elements of the graphic represent numerical values.
Re: Bad Graphs
Posted: Wed Aug 09, 2023 2:36 pm
by IvanV
dyqik wrote: ↑Wed Aug 09, 2023 2:22 pm
bjn wrote: ↑Wed Aug 09, 2023 2:21 pm
Do bar charts, however bad, not count as graphs?
A bar chart does. It's a
graphical representation of numerical data, where the geometry of elements of the graphic represent numerical values.
It is bad graphical design, rather than a bad graph.
It was not intended to be a bar chart. It just accidentally looks like one due to foolish design.
Re: Bad Graphs
Posted: Wed Aug 09, 2023 2:47 pm
by Grumble
dyqik wrote: ↑Wed Aug 09, 2023 2:21 pm
Grumble wrote: ↑Wed Aug 09, 2023 2:10 pm
dyqik wrote: ↑Wed Aug 09, 2023 1:40 pm
There's not a graph in that image (apart from the % of the vote counted progress bar at the bottom right).
So many "bad graph" posts aren't intended to be graphs, and it's the poster interpreting graphics as a graph when it clearly isn't one.
True, but fair to say it’s a bad graphic. If there was an equally sized cross in a box below the tick the confusion wouldn’t arise. Apart from the confusion of No having a tick and Yes having a cross.
This is the way all CNN election results graphics are done, though. So it's not like it's an unfamiliar graphic convention.
Just lining the numbers up would be enough I think.
Re: Bad Graphs
Posted: Wed Aug 09, 2023 3:35 pm
by bjn
dyqik wrote: ↑Wed Aug 09, 2023 2:22 pm
bjn wrote: ↑Wed Aug 09, 2023 2:21 pm
Do bar charts, however bad, not count as graphs?
A bar chart does. It's a
graphical representation of numerical data, where the geometry of elements of the graphic represent numerical values.
Graphical design so bad it looks like its meant to be a bar chart. Blah. Someone needs Cluebringer upside the head.
Re: Bad Graphs
Posted: Wed Aug 09, 2023 3:51 pm
by monkey
IvanV wrote: ↑Wed Aug 09, 2023 2:36 pm
dyqik wrote: ↑Wed Aug 09, 2023 2:22 pm
bjn wrote: ↑Wed Aug 09, 2023 2:21 pm
Do bar charts, however bad, not count as graphs?
A bar chart does. It's a
graphical representation of numerical data, where the geometry of elements of the graphic represent numerical values.
It is bad graphical design, rather than a bad graph.
It was not intended to be a bar chart. It just accidentally looks like one due to foolish design.
It might not be that bad in context. If they were doing updates of the count throughout the programme, a viewer would have presumably seen two full grey bars up until the winner was declared - obviously not a graph. When the tick appears, I doubt very many would go "Oh, that was a bar chart was it? Silly me."
Re: Bad Graphs
Posted: Tue Sep 26, 2023 3:32 pm
by Gfamily
Misleading chart from Which? magazine - purporting to show how much more Caffeine in one 'energy' drink than in another.
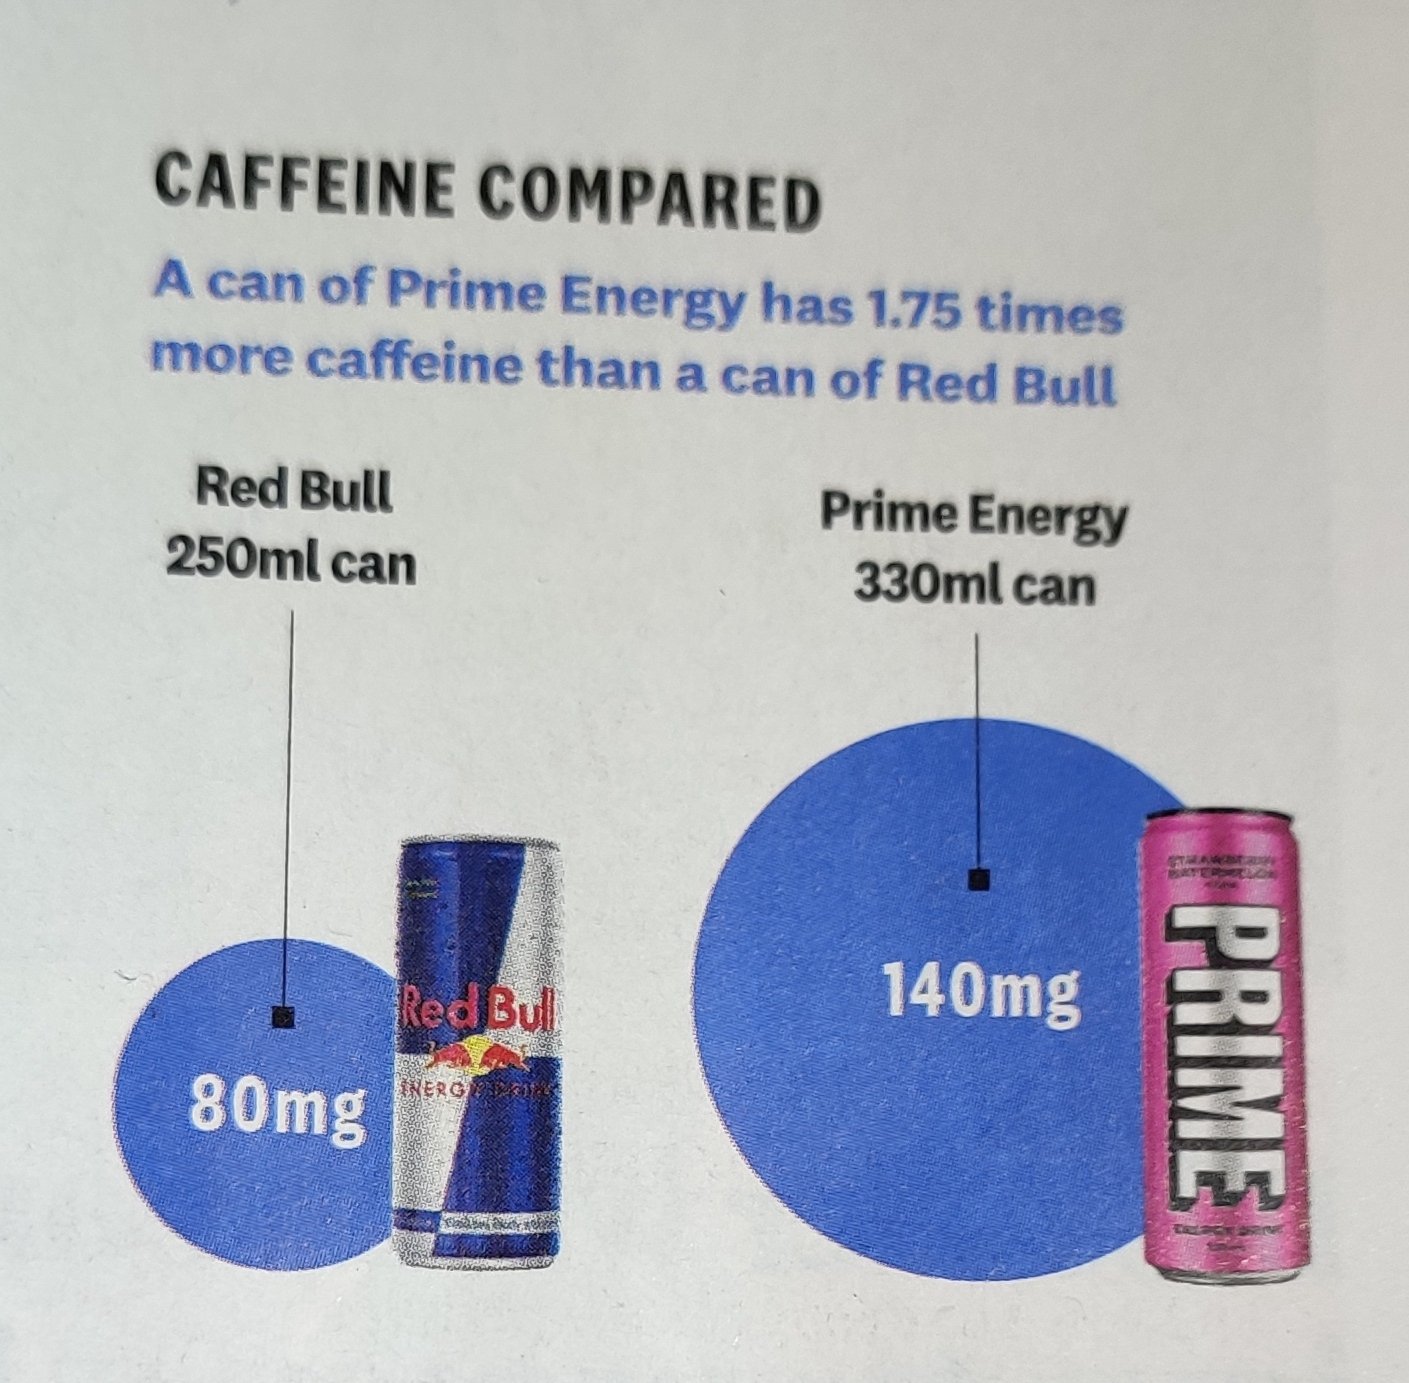
Meant to be showing 1.75 times more, but but showing an area that's 3 times more
Re: Bad Graphs
Posted: Wed Sep 27, 2023 6:23 am
by Grumble
Have they increased the diameter 1.75 times?
Re: Bad Graphs
Posted: Wed Sep 27, 2023 6:47 am
by shpalman
Grumble wrote: ↑Wed Sep 27, 2023 6:23 am
Have they increased the diameter 1.75 times?
But they should have only increased it 1.3 times.
Re: Bad Graphs
Posted: Wed Sep 27, 2023 7:14 am
by jimbob
spalman wrote: ↑Wed Sep 27, 2023 6:47 am
Grumble wrote: ↑Wed Sep 27, 2023 6:23 am
Have they increased the diameter 1.75 times?
But they should have only increased it 1.3 times.
Also, a lot of the difference between the amount of caffeine is because one is 250ml and the other is 330ml
Re: Bad Graphs
Posted: Wed Sep 27, 2023 10:04 am
by Gfamily
Grumble wrote: ↑Wed Sep 27, 2023 6:23 am
Have they increased the diameter 1.75 times?
Roughly that.