tenchboy wrote: Thu May 09, 2024 11:41 am
I'm sorry I didn't get far with this one
England river clean-up effort ‘poor’, says watchdog [BBC]
Because when I got to...
A government spokesperson said this government had done "more than any other" to restore waterways.
I couldn't think of anything other than, "but how many years have you been in control now? This is your fault and no-one elses"; and turned the page.
I readily admit, not having read the complete article, that I may be rushing to judgment but my prejudice comforts me.
The key here is to find some data over time.
Here is some data back to 1986 on some important chemical indicators of quality. It stops in 2019, for the moment, because of Covid. So for these four chemical indicators of quality, which I will summarise in words as they are in separate graphs:
Ammonia - was roughly level at 0.1 mg/l 2010-19, having come down rapidly from around 0.7 mg/l in the late 80s.
Phospate - was roughly level at 0.2 mg/l 2010-19, having come down rapidly from around 1.1 mg/l in the late 80s
Biochemical Oxygen Demand - reduced from about 3.2mg/l to plateau at 1.7mg/l in the late noughties, but has since rebounded to around 2.0 mg/l
Nitrate - reduced from about 6 mg/l to plateau at about 4.5 mg/l in the late noughties, but has since rebounded to around or over 5 mg/l
So some important progress over time on ammonia and phosphate, which has been maintained in recent years. But some indication of reversal of the trend in BOD and nitrate, starting just when the Tories came to office, who'd have guessed it.
Here is some data back to 2009 on surface water biodiversity status classification. Unfortunately it doesn't go further back, and it is worth copying in the main graph.
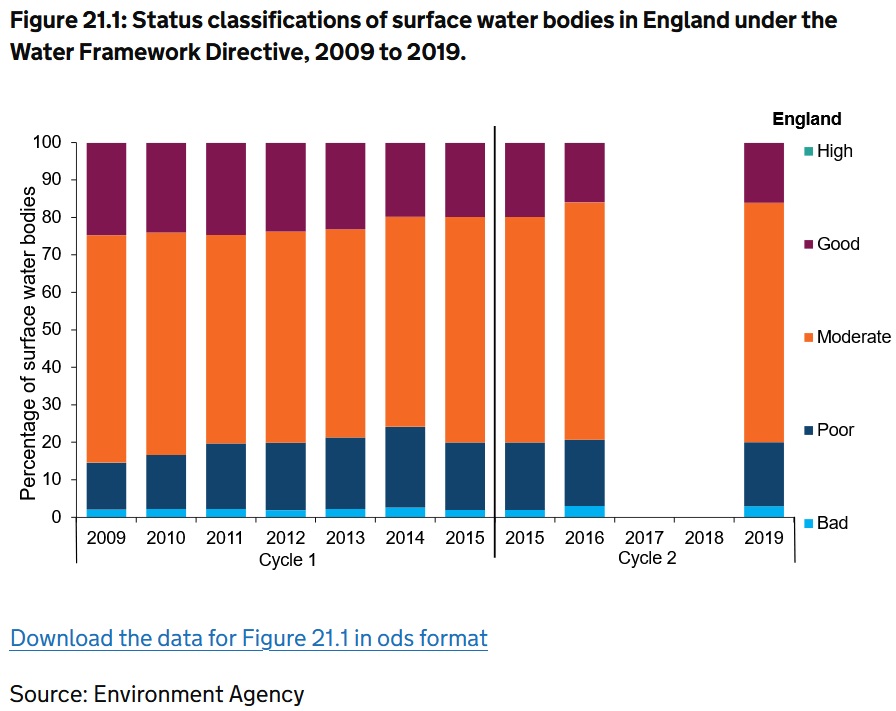
- Surface Water Status Classifications.jpg (123.06 KiB) Viewed 10082 times
As we can see, things have been trending worse more or less for the entire period of the graph. It would be nice to see how it was back in the 80s, for comparability, as I suspect things were really dreadful back then. But as with the graphs above, there is evidence of a backward trend for the period of the Tory administration.
I don't think there is anything newer than this. This gives
much more detail on the latest figures, but in most cases the latest figures are 2019.
So when they say "done more than any other", that is certainly not reflected in outcomes, as the visible trend on all the key indicators is either worse or level. And some really large improvements were achieved back in the 1990s to early 2000s.
I don't think the government spends money itself on these things, rather it directs water companies to spend money collected from water customers on things. Maybe they have directed the water companies to spend more that they have been spending before. But evidently they are fighting a battle against the previous decade of neglect.