An article comparing Lombardy with the rest of Italy:
https://www.theguardian.com/world/2020/ ... er-regions
COVID-19
-
shpalman

- Princess POW
- Posts: 8317
- Joined: Mon Nov 11, 2019 12:53 pm
- Location: One step beyond
- Contact:
Re: COVID-19
having that swing is a necessary but not sufficient condition for it meaning a thing
@shpalman@mastodon.me.uk
@shpalman@mastodon.me.uk
-
discovolante

- Stummy Beige
- Posts: 4109
- Joined: Fri Oct 11, 2019 5:10 pm
Re: COVID-19
Yes and I'm a bit worried about Scotland too to be honest. Up to 8 people on each others gardens, advice being 'if you have a barbecue, use your own food and cutlery and don't go to the toilet, and stay socially distanced' - which seems unrealistic to be honest. People drink booze at barbecues and kids run around. Garden centres etc are opening too. However it's outside mostly, schools are staying shut and there hasn't been a push to send people back to work, which i guess are bigger risk factors. So perhaps it won't be so bad but I'm just not sure how different individuals are going to respond.EACLucifer wrote: ↑Fri May 29, 2020 3:27 am
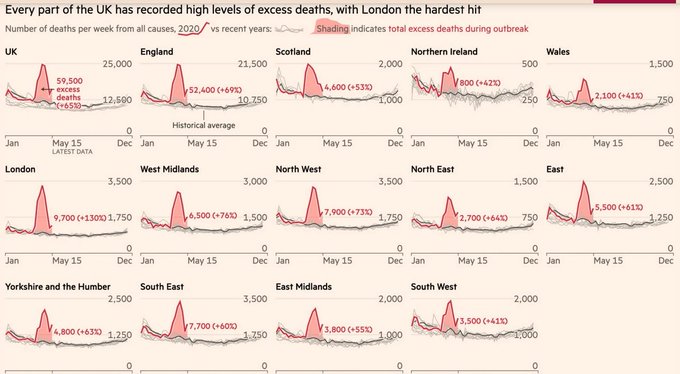
This looks pretty bad. I know its early so far, but to me it seems notable that advice was to start going back to work etc a bit over two weeks back, and that Scotland's devolved government openly and strongly disagreed with that saying advice remained to stay home. Now every region but Scotland has recorded increased deaths.
Suffice to say I hope this is some statistical artifact, a cockup in how deaths are counted, but I fear it is not.
To defy the laws of tradition is a crusade only of the brave.
-
Woodchopper

- Princess POW
- Posts: 7144
- Joined: Sat Oct 12, 2019 9:05 am
Re: COVID-19
I think its more likely to be an artifact of how the numbers are presented. The graph is from here: https://www.ft.com/content/6b4c784e-c25 ... 8ffde71bf0 and the author doesn't remark upon an upturn in UK deaths.EACLucifer wrote: ↑Fri May 29, 2020 3:27 am
This looks pretty bad. I know its early so far, but to me it seems notable that advice was to start going back to work etc a bit over two weeks back, and that Scotland's devolved government openly and strongly disagreed with that saying advice remained to stay home. Now every region but Scotland has recorded increased deaths.
Suffice to say I hope this is some statistical artifact, a cockup in how deaths are counted, but I fear it is not.
Also the surveillance report doesn't show an upturn in other indicators at that time: https://assets.publishing.service.gov.u ... _Final.pdf
Though there is a more recent increase in hospital admissions (see page 17). Which is something to worry about.
-
FlammableFlower
- Dorkwood
- Posts: 1513
- Joined: Mon Nov 11, 2019 1:22 pm
Re: COVID-19
Weston-super-Mare hospital has closed to new admissions for a week due to overwhelming COVID numbers.
What's annoying is that people are blaming the hospital managers rather than looking at the actions of the wider community. Now there is a possibility that it could be nosocomial, but I'd be highly surprised that it would be to that extent and not being brought in from the community.
What's annoying is that people are blaming the hospital managers rather than looking at the actions of the wider community. Now there is a possibility that it could be nosocomial, but I'd be highly surprised that it would be to that extent and not being brought in from the community.

Re: COVID-19
Here's a picture of how hot the UK is currently running, compared to other European countries. All figures Our World In Data
Deaths - last 7 days deaths (official figures)
UK 1,756
Spain 1,102
Italy 742
France 464
Sweden 389
Germany 264
Belgium 214
Netherlands 123
Portugal 93
Greece 7
When other countries fell below UK's current deaths level of 1,756 per week / days since
Spain 6 May / 22
Italy 10 May / 18
France 7 May / 21
Sweden NA
Germany 22 April / 36
Belgium 24 April / 34
Netherlands NA
Portugal NA
Greece NA
Cases - last 7 days deaths (official figures)
UK 18,947
Spain 4,214
Italy 3,775
France 1,901
Sweden 3,565
Germany 2,965
Belgium 1,609
Netherlands 1,321
Portugal 1,632
Greece 53
When other countries fell below UK's current cases level of 18,947 per week / days since
Spain 22 April / 36
Italy 27 April / 31
France 18 April / 40
Sweden NA
Germany 20 April / 38
Belgium NA
Netherlands NA
Portugal NA
Greece NA
 Awarded gold star 4 November 2021
Re: COVID-19
- the UK is running far too hot to commence any unlockdown
- it's so obvious that we're running hot, that it must be a deliberate policy decision to keep running hot, presumably to get the economy restarting earlier
- we are 3 to 5 weeks behind other countries, so a sane properly-run country would look at what steps they are doing now and plan to do the same in July
- Holding R close to 1.0, or in the 0.8 to 1.0 ranges is very different when you are at Germany levels (plenty of room to react if numbers start going bad on you) to when you are at UK levels (walking at the cliff edge if numbers start going bad)
- If we'd have locked down as early as Germany we would be unlockdowning now with a small case load
- R=1 means a very high plateau for the UK to stay on, and even R=0.8 means a long, slow downwards slope
- people generally won't know the huge timing differences between the UK and other countries, and will see reports of Greek beaches opening up or German football matches, and will assume we're in a similar place to restart
- the UK's lead in deaths and cases will keep widening for the next few months, giving us an unassailable lead even in the event of second waves, finally proving British exceptionalism once and for all
Awarded gold star 4 November 2021-
Little waster

- After Pie
- Posts: 2385
- Joined: Tue Nov 12, 2019 12:35 am
- Location: About 1 inch behind my eyes
Re: COVID-19
Yay we are finally "4 weeks behind Italy"!
Good job everyone, we showed those nay-sayers,
I'd like to say it was a team effort but, and I know they are both too modest to take all the credit themselves, I think we all have to appreciate the (British) sterling effort by Johnson and Cummings to secure the UK's top spot. Couldn't have done it without youse.
Stellar job, mate!
This place is not a place of honor, no highly esteemed deed is commemorated here, nothing valued is here.
What is here was dangerous and repulsive to us.
This place is best shunned and left uninhabited.
What is here was dangerous and repulsive to us.
This place is best shunned and left uninhabited.
-
Woodchopper
- Princess POW
- Posts: 7144
- Joined: Sat Oct 12, 2019 9:05 am
Re: COVID-19
The increase in hospital admissions is in London. I guess that the Weston-super-Mare hospital isn't enough to affect the regional trend.FlammableFlower wrote: ↑Fri May 29, 2020 7:56 amWeston-super-Mare hospital has closed to new admissions for a week due to overwhelming COVID numbers.
What's annoying is that people are blaming the hospital managers rather than looking at the actions of the wider community. Now there is a possibility that it could be nosocomial, but I'd be highly surprised that it would be to that extent and not being brought in from the community.

Re: COVID-19
discovolante wrote: ↑Fri May 29, 2020 6:36 amYes and I'm a bit worried about Scotland too to be honest. Up to 8 people on each others gardens, advice being 'if you have a barbecue, use your own food and cutlery and don't go to the toilet, and stay socially distanced' - which seems unrealistic to be honest. People drink booze at barbecues and kids run around. Garden centres etc are opening too. However it's outside mostly, schools are staying shut and there hasn't been a push to send people back to work, which i guess are bigger risk factors. So perhaps it won't be so bad but I'm just not sure how different individuals are going to respond.EACLucifer wrote: ↑Fri May 29, 2020 3:27 am
This looks pretty bad. I know its early so far, but to me it seems notable that advice was to start going back to work etc a bit over two weeks back, and that Scotland's devolved government openly and strongly disagreed with that saying advice remained to stay home. Now every region but Scotland has recorded increased deaths.
Suffice to say I hope this is some statistical artifact, a cockup in how deaths are counted, but I fear it is not.
That upturn I mentioned in that now looks to have slowed down at least. It is probably the best leading indicator, but with some self-selection.jimbob wrote: ↑Fri May 22, 2020 8:58 pmJust had a look at the
https://covid.joinzoe.com/data#levels-over-time graph over time.
Why is it animated? and why can't they give their data as a table as well?
One thing I also note, is that their estimate of infections peaked around 1st May, which is far too late given the death rate. So I am quite dubious about their assumptions - possibly self-selection.
But if the VE day messing about has had an effect, there might be a hint of that feeding through into the figures for the last couple of days..
Have you considered stupidity as an explanation

Re: COVID-19
Is some upturn related to extra delay in reporting due to the bank holiday?
where once I used to scintillate
now I sin till ten past three
now I sin till ten past three
Re: COVID-19
That is my thinking about the upturn in the death rates, but not the increase in the hospital admissions. https://twitter.com/ChrisGiles_/status/ ... 9334078466
Have you considered stupidity as an explanation

Re: COVID-19
"Three weeks after VE day" as one commenter notes.jimbob wrote: ↑Fri May 29, 2020 12:48 pmThat is my thinking about the upturn in the death rates, but not the increase in the hospital admissions. https://twitter.com/ChrisGiles_/status/ ... 9334078466
Re: COVID-19
On a Zoom thing last night, people didn't like the Diablo, E.P. principle of taking absolute figures rather than per million figures. I tried to say that the UK's 2,000 new fires per day shows how likely an out-of-contol blaze is, but they kept excusing UK bad figures by saying it's just a function of the size of the country. (Note, the official UK figure is 2,000 new cases per day, based on testing. The ONS estimate is 7,500 per day.)
Data in per million population:
Daily Cases per million currently (official figures)
Sweden 64
UK 30
Portugal 28
Spain 24
Belgium 12
Netherlands 11
Italy 10
Germany 4
France 3
Greece 1
When other countries fell below UK's current cases level of 30 per miilion / days since
Sweden NA
Portugal 4 May / 24
Spain 29 April / 29
Belgium 13 May / 15
Netherlands 28 April / 30
Italy 4 May / 24
Germany 19 April / 39
France 23 April / 35
Greece NA
I think it's remarkable how sustained the UK plateau is. Most other countries show more of a ^ shape to the curve, even if mostly slower on the downslope. The outliers are UK and Sweden, and to a lesser extent Belgium .
Awarded gold star 4 November 2021Re: COVID-19
For cases, there's a fundamental problem with looking at the history - failure to test, particularly in the UK, until recently.
But here's a comparison of when countries officially reached their current case level on the way up, back in March.
Current Cases - last 7 days (official figures)
UK 18,947
Spain 4,214
Italy 3,775
France 1,901
Sweden 3,565
Germany 2,965
Belgium 1,609
Netherlands 1,321
Portugal 1,632
Greece 53
Country reached cases of X / on date Y
UK 18,947 / 2 April
Spain 4,214 / 13 March
Italy 3,775 / 8 March
France 1,901 / 12 March
Sweden 3,565 / 10 April
Germany 2,965 / 16 March
Belgium 1,609 / 21 March
Netherlands 1,321 / 18 March
Portugal 1,632 / 24 March
Greece 53 / 8 March
I think this would be a good metric if cases data was reliable - shows Germany level on 16 March, facing rising cases and with R>1, is the level it's at now with failing cases and R under control. Whereas UK and Sweden are still way above pre-lockdown levels.
Maybe a good metric would be: cases now as a percentage of cases on a country's lockdown day?
Awarded gold star 4 November 2021-
Woodchopper
- Princess POW
- Posts: 7144
- Joined: Sat Oct 12, 2019 9:05 am
Re: COVID-19
Actually, there's an uptick in the Guardian graphs as well. https://www.theguardian.com/world/ng-in ... els-europe Which will be based on the same data.Woodchopper wrote: ↑Fri May 29, 2020 6:52 amI think its more likely to be an artifact of how the numbers are presented. The graph is from here: https://www.ft.com/content/6b4c784e-c25 ... 8ffde71bf0 and the author doesn't remark upon an upturn in UK deaths.EACLucifer wrote: ↑Fri May 29, 2020 3:27 am
This looks pretty bad. I know its early so far, but to me it seems notable that advice was to start going back to work etc a bit over two weeks back, and that Scotland's devolved government openly and strongly disagreed with that saying advice remained to stay home. Now every region but Scotland has recorded increased deaths.
Suffice to say I hope this is some statistical artifact, a cockup in how deaths are counted, but I fear it is not.
Also the surveillance report doesn't show an upturn in other indicators at that time: https://assets.publishing.service.gov.u ... _Final.pdf
Though there is a more recent increase in hospital admissions (see page 17). Which is something to worry about.
As there doesn't seem to have been an increase in Covid deaths in mid-May I'm wondering whether there is usually a decrease in general mortality as the summer approaches, so excess deaths have increased, eg that the upturn is due to a change in the denominator rather than the numerator.
-
shpalman
- Princess POW
- Posts: 8317
- Joined: Mon Nov 11, 2019 12:53 pm
- Location: One step beyond
- Contact:
Re: COVID-19
The "numerator" is the light grey line. The excess death calculation is a subtraction not a division.
having that swing is a necessary but not sufficient condition for it meaning a thing
@shpalman@mastodon.me.uk
@shpalman@mastodon.me.uk
Re: COVID-19
Having an inkling I used to know this, I asked a handy maths teacher and she didn't know, but then I asked Wiki P and the equivalents to numerator and denominator are minuend and subtrahend. This confirms to me that no, I absolutely did not know that.
-
shpalman
- Princess POW
- Posts: 8317
- Joined: Mon Nov 11, 2019 12:53 pm
- Location: One step beyond
- Contact:
Re: COVID-19
I should of said denominator anyway, but yeah you can see the red line (which is the total deaths) going up when they grey line is just gently decreasing. So if it's an artefact it wouldn't be from a changing baseline.
having that swing is a necessary but not sufficient condition for it meaning a thing
@shpalman@mastodon.me.uk
@shpalman@mastodon.me.uk
-
Bird on a Fire

- Princess POW
- Posts: 10142
- Joined: Fri Oct 11, 2019 5:05 pm
- Location: Portugal
Re: COVID-19
I'm also not sure of on what my honourable friend is basing "there doesn't seem to have been an increase in Covid deaths in mid-May" - deaths following hospitalisation?
We have the right to a clean, healthy, sustainable environment.
-
Woodchopper
- Princess POW
- Posts: 7144
- Joined: Sat Oct 12, 2019 9:05 am
-
Woodchopper
- Princess POW
- Posts: 7144
- Joined: Sat Oct 12, 2019 9:05 am
Re: COVID-19
The surveillance report I linked to upthread. Data from lots of different sources. None of which suggested a worsening Covid trend two weeks ago.Bird on a Fire wrote: ↑Sat May 30, 2020 12:08 pmI'm also not sure of on what my honourable friend is basing "there doesn't seem to have been an increase in Covid deaths in mid-May" - deaths following hospitalisation?
-
sTeamTraen

- After Pie
- Posts: 2558
- Joined: Mon Nov 11, 2019 4:24 pm
- Location: Palma de Mallorca, Spain
Re: COVID-19
Here (very crudely plotted) is the 7-day moving average of UK cases. It seems to be levelling off, but of course a lot depends on testing policies.
Data are from ecdc.eu, which sometimes differs from other sources - but the UK figures are nicely regular, with just one data release per day and so far no post hoc adjustments, so every site tends to have the same numbers. (The last week's official death counts from Spain have been 74, -1918 [sic], 283, 2, 1, 1, and 4 --- they have been catching up with a lot of double-counting but the big negative number annoyed a lot of people, so I guess they're making up for that by offsetting the negative numbers against each day's true positive number.)
Data are from ecdc.eu, which sometimes differs from other sources - but the UK figures are nicely regular, with just one data release per day and so far no post hoc adjustments, so every site tends to have the same numbers. (The last week's official death counts from Spain have been 74, -1918 [sic], 283, 2, 1, 1, and 4 --- they have been catching up with a lot of double-counting but the big negative number annoyed a lot of people, so I guess they're making up for that by offsetting the negative numbers against each day's true positive number.)
- Attachments
-
- ukcases.png (9.68 KiB) Viewed 4688 times
Something something hammer something something nail
-
Woodchopper
- Princess POW
- Posts: 7144
- Joined: Sat Oct 12, 2019 9:05 am
Re: COVID-19
Here's the answer:
Looks like a statistical artifact after all.
- excess deaths.jpg (140.45 KiB) Viewed 4649 times
Re: COVID-19
If you’ll pardon the anecdote, my brother in law’s father in law has died with Covid 19 on his death certificate this week. He was receiving treatment for cancer, he was due for a surgery but contracted Covid 19 and couldn’t get the surgery. He didn’t exactly die of Covid, but because of it, if you see what I mean. I wonder how many of the excess deaths are like that. Although in his case he will be recorded as a Covid case I can also see how he might not have been.
where once I used to scintillate
now I sin till ten past three
now I sin till ten past three
Re: COVID-19
Yes, that explained the deaths but not the hint of an increase in the London hospital admissionsWoodchopper wrote: ↑Sat May 30, 2020 8:15 pmHere's the answer:
excess deaths.jpg
Looks like a statistical artifact after all.
Have you considered stupidity as an explanation