COVID-19
-
shpalman

- Princess POW
- Posts: 8271
- Joined: Mon Nov 11, 2019 12:53 pm
- Location: One step beyond
- Contact:
Re: COVID-19
For the first half try multiplying the deaths by ~10 and for the second half try ~100. In any case, this factor (basically 1/CFR) is also a parameter which needs to be fit along with the lag.
having that swing is a necessary but not sufficient condition for it meaning a thing
@shpalman@mastodon.me.uk
@shpalman@mastodon.me.uk
Re: COVID-19
As I've just clarified to eejaytee. I've been working in logs.
As you've pointed out, that means any constant factor doesn't affect the correlations.
I suggest that the parallel lines over the last couple of months (my post Nov 09, 2020 2:38 pm) indicates a constant CFR over that rate.
As the cases are those detected, and deaths are unlikely to be missed, I suggest that in turn indicates the proportion of all cases being detected is constant over that period - a topic briefly discussed up-thread.

Re: COVID-19
If you look at linear plots on different scales for deaths and cases, you can see the clipping of the cases due to testing capacity in the first wave.
I think it's hard to predict where the peak would have been with a varying and increasing testing capacity altering the case data (and the deaths data as well for this 28-day definition)
- Screenshot 2020-11-09 193955.png (37.6 KiB) Viewed 3085 times
Have you considered stupidity as an explanation
Re: COVID-19
Yes. We should be sceptical about data.jimbob wrote: ↑Mon Nov 09, 2020 7:43 pmIf you look at linear plots on different scales for deaths and cases, you can see the clipping of the cases due to testing capacity in the first wave.
Screenshot 2020-11-09 193955.png
I think it's hard to predict where the peak would have been with a varying and increasing testing capacity altering the case data (and the deaths data as well for this 28-day definition)
linkJosiahStamp wrote:The government are very keen on amassing statistics. They collect them, add them, raise them to the nth power, take the cube root and prepare wonderful diagrams. But you must never forget that every one of these figures comes in the first instance from the village watchman, who just puts down what he damn pleases.
-
Millennie Al
- After Pie
- Posts: 1621
- Joined: Mon Mar 16, 2020 4:02 am
Re: COVID-19
Since it's not possible for there to be no lag, either or both of the figures are systematically wrong. While we can be pretty certain that sombody reported as dead really is dead, the other aspects are not so certain, so:
- those dead of COVID are miscounted due to wrong COVID status
- those counted as cases of COVID are miscounted due to incorrect test results
- their is a bias in who is tested for COVID resuling in the count of cases being systematically wrong

Re: COVID-19
Are your case data based on the date of the positive test, or on the date of first symptoms?
The clearest lag should be between initial infection and death. That being impossible, the next clearest lag should be between first symptoms and death. If that isn't what you've got, then it makes sense for there to be a less clear lag between symptoms-bad-enough-to-get-tested and deaths.
The clearest lag should be between initial infection and death. That being impossible, the next clearest lag should be between first symptoms and death. If that isn't what you've got, then it makes sense for there to be a less clear lag between symptoms-bad-enough-to-get-tested and deaths.
Re: COVID-19
The COVID.JOINZOE.COM data said that the peak in symptoms was 1st April.bolo wrote: ↑Tue Nov 10, 2020 2:59 amAre your case data based on the date of the positive test, or on the date of first symptoms?
The clearest lag should be between initial infection and death. That being impossible, the next clearest lag should be between first symptoms and death. If that isn't what you've got, then it makes sense for there to be a less clear lag between symptoms-bad-enough-to-get-tested and deaths.
Have you considered stupidity as an explanation
Re: COVID-19
I've used the UK government data at coronavirus.data.gov.uk where you can read a full description of the data and download it in sections. If you want to get the same variables I used (updated to date) in one set this URL longURL should download it as a CSV. I import it directly into Google Sheets using IMPORTDATA(). For R, building on the code on that site I have a function to import it as a dataframe, code available on request, no warranty or support.bolo wrote: ↑Tue Nov 10, 2020 2:59 amAre your case data based on the date of the positive test, or on the date of first symptoms?
The clearest lag should be between initial infection and death. That being impossible, the next clearest lag should be between first symptoms and death. If that isn't what you've got, then it makes sense for there to be a less clear lag between symptoms-bad-enough-to-get-tested and deaths.
To answer your question, the analysis in my recent posts was based on positive cases by date of sample (SpecCases) and deaths by date of death (DeathDates). I consider that data more meaningful than by date of publication, which is more commonly quoted and is also available on that site and in the data set downloaded by that link.
I'm happy that the lack of apparent lag in Spring is explained by inadequate data as demonstrated by jimbob (Nov 09, 2020 7:43 pm), and the lag in the last couple of months is about 14 days. I'm not convinced that a more precise value is possible or meaningful.
Re: COVID-19
Having escaped the rabbit hole into which I fell estimating lag, looking at the latest (yesterday's) data suggests deaths may have begun to plateau - perhaps a bit later than my 14 day estimate of the case:death lag.KAJ wrote: ↑Sun Nov 08, 2020 9:04 amYes. Covid deaths are defined as within 28 days of the first positive test result. When I have time I'll compare death growth rates with case growth rate 28 days before. Now I have the tools (R and Rstudio, another hat-tip to sTeamTraen) and ready access to the data that's easy - but Mrs KAJ looks at me when I spend too long calculating
First chart is cases by specimen date, second is deaths by date of death.
Black line is exponential regression with a 'day of week' factor. Red line is a loess smooth.
Vertical grid lines are at 4/1 week intervals.
- SpecCase.png (38.25 KiB) Viewed 2911 times
- DDeaths.png (36.85 KiB) Viewed 2911 times
-
Woodchopper

- Princess POW
- Posts: 7082
- Joined: Sat Oct 12, 2019 9:05 am
Re: COVID-19
532 today. Ouch.
Its a Monday so some catch up. But still, through the 500 reported in one day threshold.
Its a Monday so some catch up. But still, through the 500 reported in one day threshold.
Re: COVID-19
Yes, the rise in deaths by date published doesn't have much evidence of slowing down - but that trend has a lot of noise from reporting delays.Woodchopper wrote: ↑Tue Nov 10, 2020 7:32 pm532 today. Ouch.
Its a Monday so some catch up. But still, through the 500 reported in one day threshold.
Deaths by date of death doesn't have that noise but the last few are lower-than-real because of reporting delays. Nevertheless I still think it's beginning to slow - but I've always been a cock-eyed optimist.
- Screenshot 2020-11-10 at 20.11.04.png (22.72 KiB) Viewed 2849 times
-
sTeamTraen

- After Pie
- Posts: 2558
- Joined: Mon Nov 11, 2019 4:24 pm
- Location: Palma de Mallorca, Spain
Re: COVID-19
In contrast to deaths, UK daily new cases have basically been static for the last three weeks (RHS of attached plot; apologies for the rudimentary graphics). This seems a bit strange, when compared to other countries that are either only just levelling off if they brought in a lockdown before or roughly at the same time as UK (Ireland, Belgium, Netherlands, France) or which are still seem to be out of control (Czechia, Poland, Italy).
This could suggest either than the tier 2 and 3 lockdowns were having an effect, or that the UK's effective test capability (which should probably be measured in positive tests that can be caught per day, rather than total tests) has been maxed out. It's probably too early to tell between those two (and, of course, any other possible explanations for 10 or 20% of the variance, give the ongoing "fog of war"), because deaths continuing to increase for a while would be plausible in either scenario.
This could suggest either than the tier 2 and 3 lockdowns were having an effect, or that the UK's effective test capability (which should probably be measured in positive tests that can be caught per day, rather than total tests) has been maxed out. It's probably too early to tell between those two (and, of course, any other possible explanations for 10 or 20% of the variance, give the ongoing "fog of war"), because deaths continuing to increase for a while would be plausible in either scenario.
- Untitled.png (7.75 KiB) Viewed 2810 times
Something something hammer something something nail
Re: COVID-19
KAJ wrote: ↑Tue Nov 10, 2020 9:49 amI've used the UK government data at coronavirus.data.gov.uk where you can read a full description of the data and download it in sections. If you want to get the same variables I used (updated to date) in one set this URL longURL should download it as a CSV. I import it directly into Google Sheets using IMPORTDATA(). For R, building on the code on that site I have a function to import it as a dataframe, code available on request, no warranty or support.bolo wrote: ↑Tue Nov 10, 2020 2:59 amAre your case data based on the date of the positive test, or on the date of first symptoms?
The clearest lag should be between initial infection and death. That being impossible, the next clearest lag should be between first symptoms and death. If that isn't what you've got, then it makes sense for there to be a less clear lag between symptoms-bad-enough-to-get-tested and deaths.
To answer your question, the analysis in my recent posts was based on positive cases by date of sample (SpecCases) and deaths by date of death (DeathDates). I consider that data more meaningful than by date of publication, which is more commonly quoted and is also available on that site and in the data set downloaded by that link.
I'm happy that the lack of apparent lag in Spring is explained by inadequate data as demonstrated by jimbob (Nov 09, 2020 7:43 pm), and the lag in the last couple of months is about 14 days. I'm not convinced that a more precise value is possible or meaningful.
Indeed - there are so many people who seem to be doing the "Assume a spherical cow" approach to the data* and building up elaborate (but not-expert) models to explain what is/was happening and thinking that the basic conditions are only affected by the virus and susceptibility of the population and ignoring the far more significant, variable and harder to model impact of human behaviour.
*From a twitter exchange with him - it seems to be Michael Levitt's** weakness.
**He's heavily quoted by covid-deniers as he *does* have a Nobel prize - but seems blind to the messier factors that have more of an effect.
Have you considered stupidity as an explanation
Re: COVID-19
sTeamTraen wrote: ↑Tue Nov 10, 2020 9:43 pmIn contrast to deaths, UK daily new cases have basically been static for the last three weeks (RHS of attached plot; apologies for the rudimentary graphics). This seems a bit strange, when compared to other countries that are either only just levelling off if they brought in a lockdown before or roughly at the same time as UK (Ireland, Belgium, Netherlands, France) or which are still seem to be out of control (Czechia, Poland, Italy).
This could suggest either than the tier 2 and 3 lockdowns were having an effect, or that the UK's effective test capability (which should probably be measured in positive tests that can be caught per day, rather than total tests) has been maxed out. It's probably too early to tell between those two (and, of course, any other possible explanations for 10 or 20% of the variance, give the ongoing "fog of war"), because deaths continuing to increase for a while would be plausible in either scenario.
Untitled.png
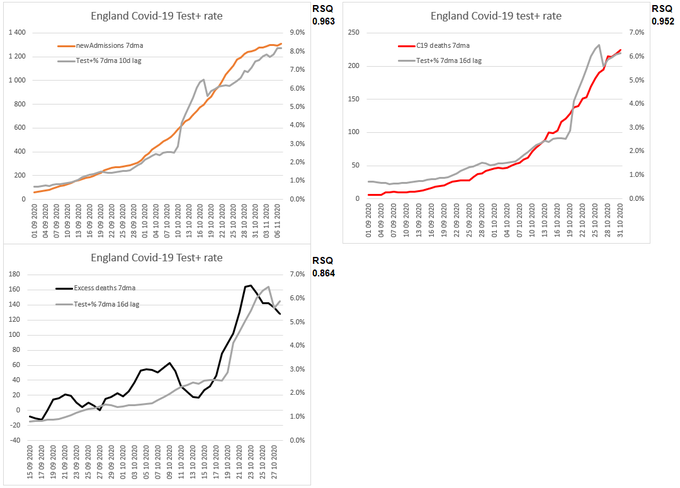
If you look at the positivity ratio for tests, I think it suggests that cases are indeed leveling off (just as they did in Spain).
It makes sense that the tier-3 restrictions would have an impact - and because of the exponential nature, would have more of an impact on the numbers increasing.
Have you considered stupidity as an explanation
-
Woodchopper
- Princess POW
- Posts: 7082
- Joined: Sat Oct 12, 2019 9:05 am
Re: COVID-19
Daily hospital admissions seem to have plateaued. So long as there isn’t a reporting lag over the weekend. https://coronavirus.data.gov.uk/details/healthcarejimbob wrote: ↑Tue Nov 10, 2020 9:57 pmsTeamTraen wrote: ↑Tue Nov 10, 2020 9:43 pmIn contrast to deaths, UK daily new cases have basically been static for the last three weeks (RHS of attached plot; apologies for the rudimentary graphics). This seems a bit strange, when compared to other countries that are either only just levelling off if they brought in a lockdown before or roughly at the same time as UK (Ireland, Belgium, Netherlands, France) or which are still seem to be out of control (Czechia, Poland, Italy).
This could suggest either than the tier 2 and 3 lockdowns were having an effect, or that the UK's effective test capability (which should probably be measured in positive tests that can be caught per day, rather than total tests) has been maxed out. It's probably too early to tell between those two (and, of course, any other possible explanations for 10 or 20% of the variance, give the ongoing "fog of war"), because deaths continuing to increase for a while would be plausible in either scenario.
Untitled.png
If you look at the positivity ratio for tests, I think it suggests that cases are indeed leveling off (just as they did in Spain).
It makes sense that the tier-3 restrictions would have an impact - and because of the exponential nature, would have more of an impact on the numbers increasing.
Re: COVID-19
It looks (ASSUMPTION ALERT!) as if the data is reported after a lag but with the appropriate date, and the plateau is quite clear.Woodchopper wrote: ↑Tue Nov 10, 2020 10:51 pmDaily hospital admissions seem to have plateaued. So long as there isn’t a reporting lag over the weekend. https://coronavirus.data.gov.uk/details/healthcare
- Screenshot 2020-11-10 at 23.05.35.png (13.13 KiB) Viewed 2779 times
Re: COVID-19
This is interesting in relation to that.sTeamTraen wrote: ↑Tue Nov 10, 2020 9:43 pmIn contrast to deaths, UK daily new cases have basically been static for the last three weeks (RHS of attached plot; apologies for the rudimentary graphics). This seems a bit strange, when compared to other countries that are either only just levelling off if they brought in a lockdown before or roughly at the same time as UK (Ireland, Belgium, Netherlands, France) or which are still seem to be out of control (Czechia, Poland, Italy).
This could suggest either than the tier 2 and 3 lockdowns were having an effect, or that the UK's effective test capability (which should probably be measured in positive tests that can be caught per day, rather than total tests) has been maxed out. It's probably too early to tell between those two (and, of course, any other possible explanations for 10 or 20% of the variance, give the ongoing "fog of war"), because deaths continuing to increase for a while would be plausible in either scenario.
Untitled.png
https://twitter.com/PienaarJm/status/13 ... 87968?s=20
Have you considered stupidity as an explanation
Re: COVID-19
Hmm. A retired engineer tweeting outside his area of expertise and saying things like...jimbob wrote: ↑Wed Nov 11, 2020 8:32 amThis is interesting in relation to that.
https://twitter.com/PienaarJm/status/13 ... 87968?s=20
... doesn't inspire me to join Twitter to hear more.... many are calling into question the use of PCR tests to measure infection. It also goes much deeper than this once you start to examine germ theory itself.
-
Little waster

- After Pie
- Posts: 2385
- Joined: Tue Nov 12, 2019 12:35 am
- Location: About 1 inch behind my eyes
Re: COVID-19
TBF germ theory has only been around since the 19th Century, whereas Hippocrates bodily humours dates back to the Iron Age, so why the unseemly rush to embrace something just because it is trendy and new-fangled.
This place is not a place of honor, no highly esteemed deed is commemorated here, nothing valued is here.
What is here was dangerous and repulsive to us.
This place is best shunned and left uninhabited.
What is here was dangerous and repulsive to us.
This place is best shunned and left uninhabited.
Re: COVID-19
Further, even a very quick look at the published data indicates thatKAJ wrote: ↑Wed Nov 11, 2020 9:06 amHmm. A retired engineer tweeting outside his area of expertise and saying things like...jimbob wrote: ↑Wed Nov 11, 2020 8:32 amThis is interesting in relation to that.
https://twitter.com/PienaarJm/status/13 ... 87968?s=20... doesn't inspire me to join Twitter to hear more.... many are calling into question the use of PCR tests to measure infection. It also goes much deeper than this once you start to examine germ theory itself.
1) the correlations he rubbishes as "purely coincidental" are very real and
2) his thesis that exponential growth in observed cases is "because with mass population testing that is expanding daily you are just sampling an ever increasing number of people" doesn't hold water.
These graphs are of COVID related numbers of: a) tests; b) cases by specimen date; c) hospital admissions; d) patients in hospital; e) in mechanical ventilation beds; f) deaths by date of death.
- Screenshot 2020-11-11 at 09.35.47.png (33.04 KiB) Viewed 2700 times
- Screenshot 2020-11-11 at 09.23.14.png (33.93 KiB) Viewed 2700 times
Re: COVID-19
I meant the reply - which showed a nice correlation between cases and hospitalisations.KAJ wrote: ↑Wed Nov 11, 2020 9:06 amHmm. A retired engineer tweeting outside his area of expertise and saying things like...jimbob wrote: ↑Wed Nov 11, 2020 8:32 amThis is interesting in relation to that.
https://twitter.com/PienaarJm/status/13 ... 87968?s=20... doesn't inspire me to join Twitter to hear more.... many are calling into question the use of PCR tests to measure infection. It also goes much deeper than this once you start to examine germ theory itself.
https://twitter.com/PienaarJm/status/13 ... 6069587968
Have you considered stupidity as an explanation
-
sTeamTraen
- After Pie
- Posts: 2558
- Joined: Mon Nov 11, 2019 4:24 pm
- Location: Palma de Mallorca, Spain
Re: COVID-19
The position of the frootloops seems to be that there is a steadily increasing percentage of false positive tests *in hospitals* --- which, as I think you were among the first to point out, would mean that some other pathogen is putting people in hospital with symptoms very like COVID-19 and we don't even have a test for it!
Something something hammer something something nail
Re: COVID-19
Indeed - it was the nice shifting and the turning points I found interesting in those graphssTeamTraen wrote: ↑Wed Nov 11, 2020 11:45 amThe position of the frootloops seems to be that there is a steadily increasing percentage of false positive tests *in hospitals* --- which, as I think you were among the first to point out, would mean that some other pathogen is putting people in hospital with symptoms very like COVID-19 and we don't even have a test for it!
Have you considered stupidity as an explanation
-
shpalman
- Princess POW
- Posts: 8271
- Joined: Mon Nov 11, 2019 12:53 pm
- Location: One step beyond
- Contact:
Re: COVID-19
Italy has nearly reached the same number of patients in non-intensive care as at the peak at the beginning of April. There are 3000 cases in intensive care, and when that happened at the end of March, it took less than two weeks to get to the peak of ~4000.
The difference as compared to the first wave is that it's only proportionately involving Lombardy, which is about half way to repeating its peak hospitalization numbers with a doubling time of roughly two weeks.
New nation-wide lockdown measures may be introduced next week based on how things are looking by Sunday (some yellow zones have already changed the bulb and become orange zones) but really if this week isn't already the peak then only a properly strict lockdown, like the one in spring, is going to work.
having that swing is a necessary but not sufficient condition for it meaning a thing
@shpalman@mastodon.me.uk
@shpalman@mastodon.me.uk