Re: COVID-19
Posted: Thu Oct 29, 2020 7:56 am
How not to fit datapoints to time series (REACT) - thrid time
It's pretty amazingly stupid.PeteB wrote: ↑Thu Oct 29, 2020 7:56 amHow not to fit datapoints to time series (REACT) - thrid time
Crazy isn't it?shpalman wrote: ↑Thu Oct 29, 2020 11:10 amThat's the one which said "Tourism is the life blood, so I'm not surprised the SC & Doc issued the exemption for more than 1500 dancers" and "It’s hard to believe that so many Dancers have Covid-19 after going to a Dance Event"?
Who would have guessed that lots of people would catch a aerosol- and contact-contagious disease from each other in an event characterized by physical exertion and close contact! Even after they had been given an exemption!
I saw that earlier. Senor von Late is teaching in person next Saturday. Bets on that the desks will be wiped down but all the doors and windows will be shut.Woodchopper wrote: ↑Thu Oct 29, 2020 4:10 pmThe best summary I’ve seen of the medical research on what activities and environments are more or less safe.
https://english.elpais.com/society/2020 ... e-air.html
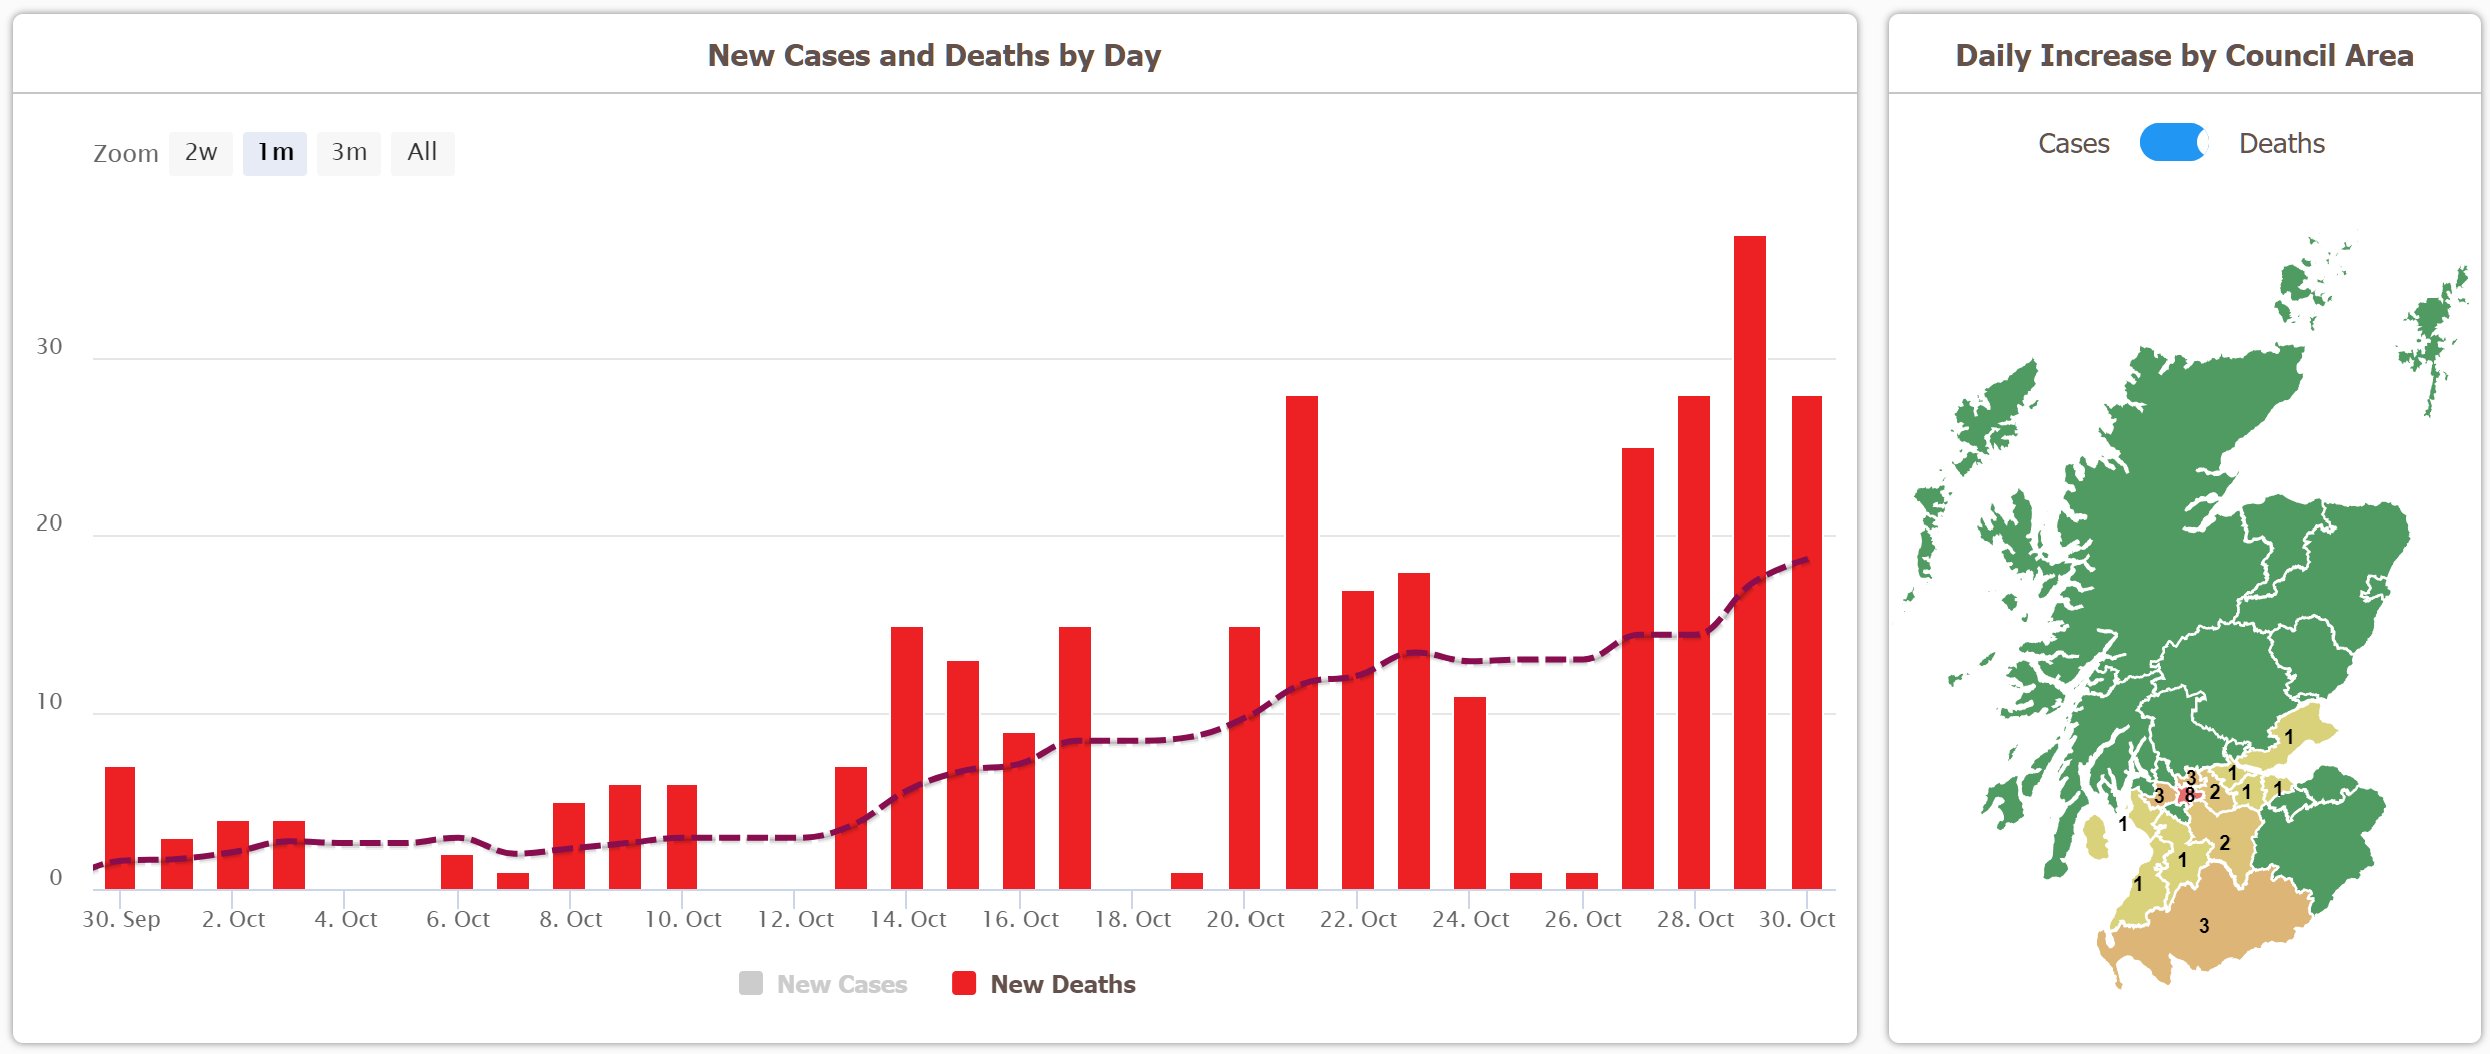
Ha I had done the same for the deaths The title is wrong, it's 7day rolling deathsEl Pollo Diablo wrote: ↑Wed Oct 28, 2020 11:15 amDaily Covid deaths weekly moving average since 1st Sept.png
Such a beautifully exponential curve.
We'll be at 1,000 deaths a day (MWA) by the 19th November at this rate - sooner, in reality, because we're on the upward part of the lognormal time series and so reporting is lagging deaths.
And 25,000 people in hospital won't be reached by "the end of November", but by the 12th/13th November, at the current doubling rate (13 days).
Covid UK Hospital Patient Numbers since 1_9_2020 (1).png
(Also a beautifully exponential curve).
It looks as though it might be slowing down. Or settling at a new slower exponential rate, possibly - hard to tellKAJ wrote: ↑Fri Oct 30, 2020 7:48 pmRegressions ln(y) v. date, data 26/9 to 30/9
y = Cases by report date
doubling time 17.1 days
slope intercept
est 0.0404 -1,775
se 0.0043 189
Rsq 72.9% 0.256 se y
---------------------
y = Patients in hospital
doubling time 12.36 days
slope intercept
est 0.0561 -2,465.94
se 0.0005 22.28
Rsq 99.6% 0.0500 se y
------------------
y = deaths by publish date
doubling time 10.51 days
slope intercept
est 0.0659 -2,903.89
se 0.0046 202.17
Rsq 81.5% 0.4537 se y
----------------------
As we expect deaths to lag patients to lag cases, does that sequence of doubling times suggest that rate of increase has reduced over the past few weeks?
It is always going to be a few days, because changing the law takes time.lpm wrote: ↑Fri Oct 30, 2020 10:30 pmSo, another national lockdown for England.
As per March, but with nurseries/schools/unis open.
And not till after a few days of dithering either.
Can't be arsed right now to work out how many weeks too late this is. After Germany, before France, dunno compared to Ireland and Belgium.
It's interesting that the most reliable data - hospitalisations - also has a near-perfect exponential fit based on R^2, with the more methodologically-inadequate numbers fitting more loosely.jimbob wrote: ↑Fri Oct 30, 2020 8:45 pmIt looks as though it might be slowing down. Or settling at a new slower exponential rate, possibly - hard to tellKAJ wrote: ↑Fri Oct 30, 2020 7:48 pmRegressions ln(y) v. date, data 26/9 to 30/9
y = Cases by report date
doubling time 17.1 days
slope intercept
est 0.0404 -1,775
se 0.0043 189
Rsq 72.9% 0.256 se y
---------------------
y = Patients in hospital
doubling time 12.36 days
slope intercept
est 0.0561 -2,465.94
se 0.0005 22.28
Rsq 99.6% 0.0500 se y
------------------
y = deaths by publish date
doubling time 10.51 days
slope intercept
est 0.0659 -2,903.89
se 0.0046 202.17
Rsq 81.5% 0.4537 se y
----------------------
As we expect deaths to lag patients to lag cases, does that sequence of doubling times suggest that rate of increase has reduced over the past few weeks?
Screenshot 2020-10-30 204232.png
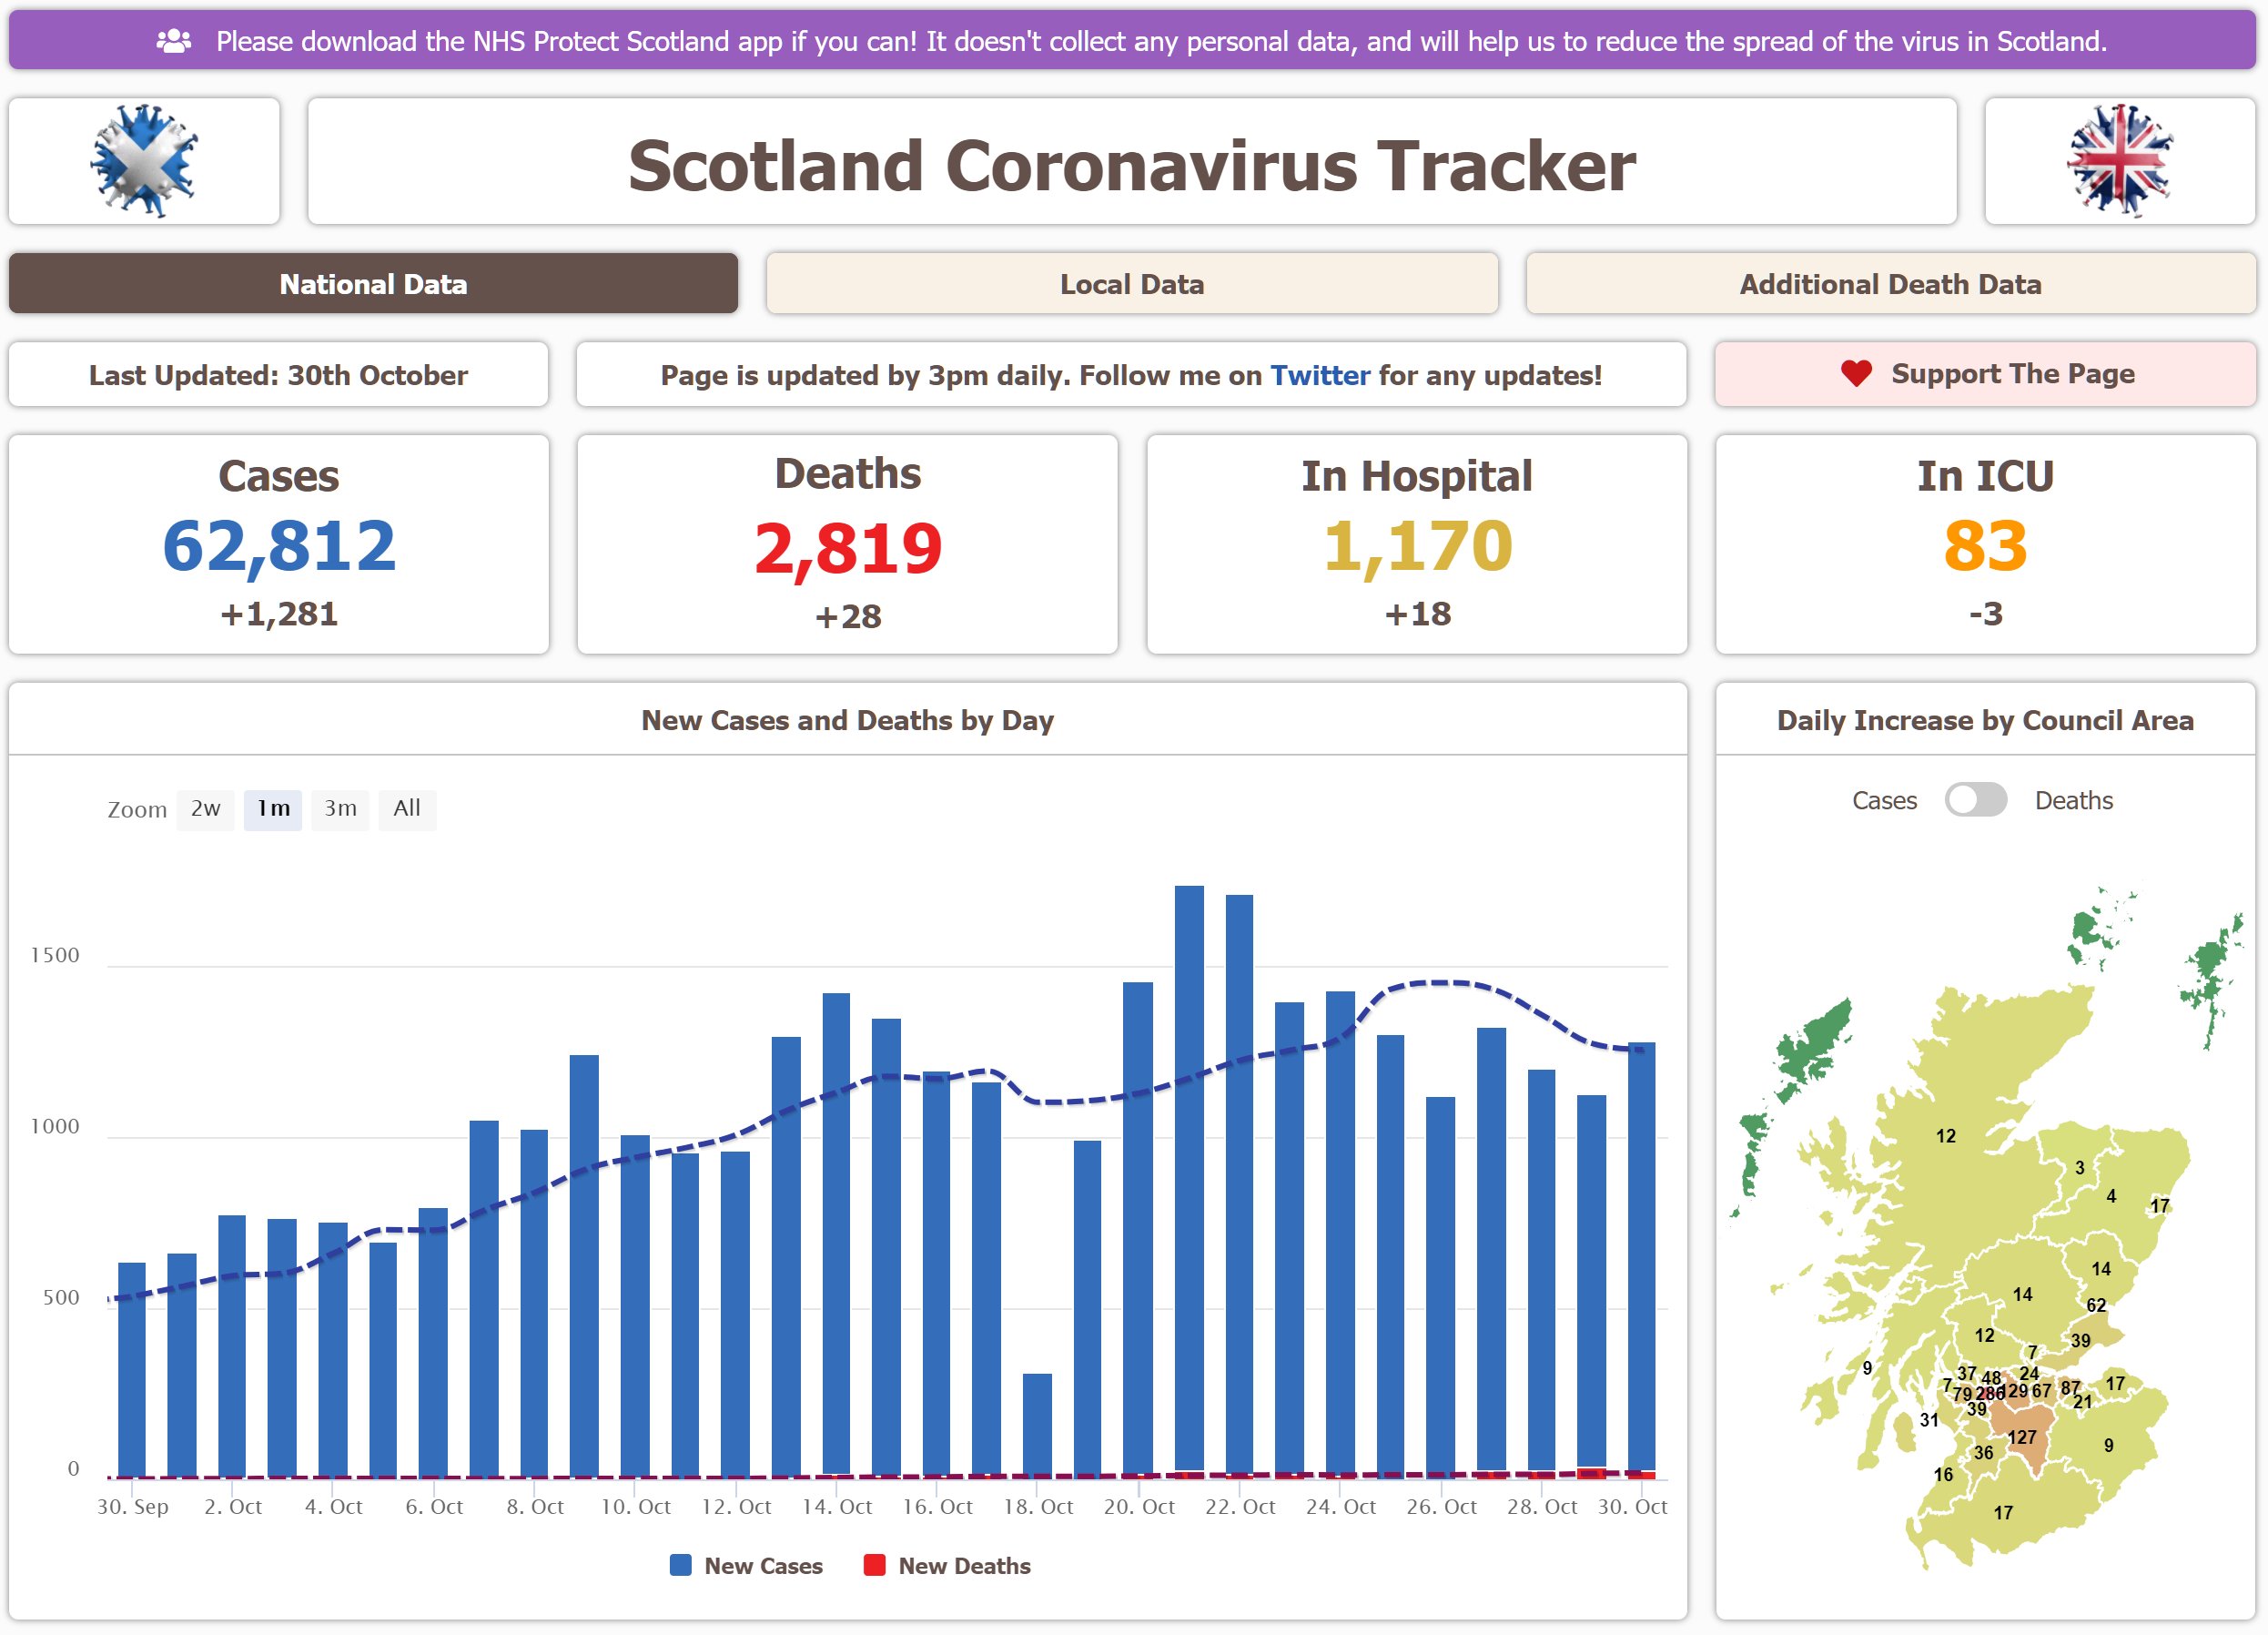
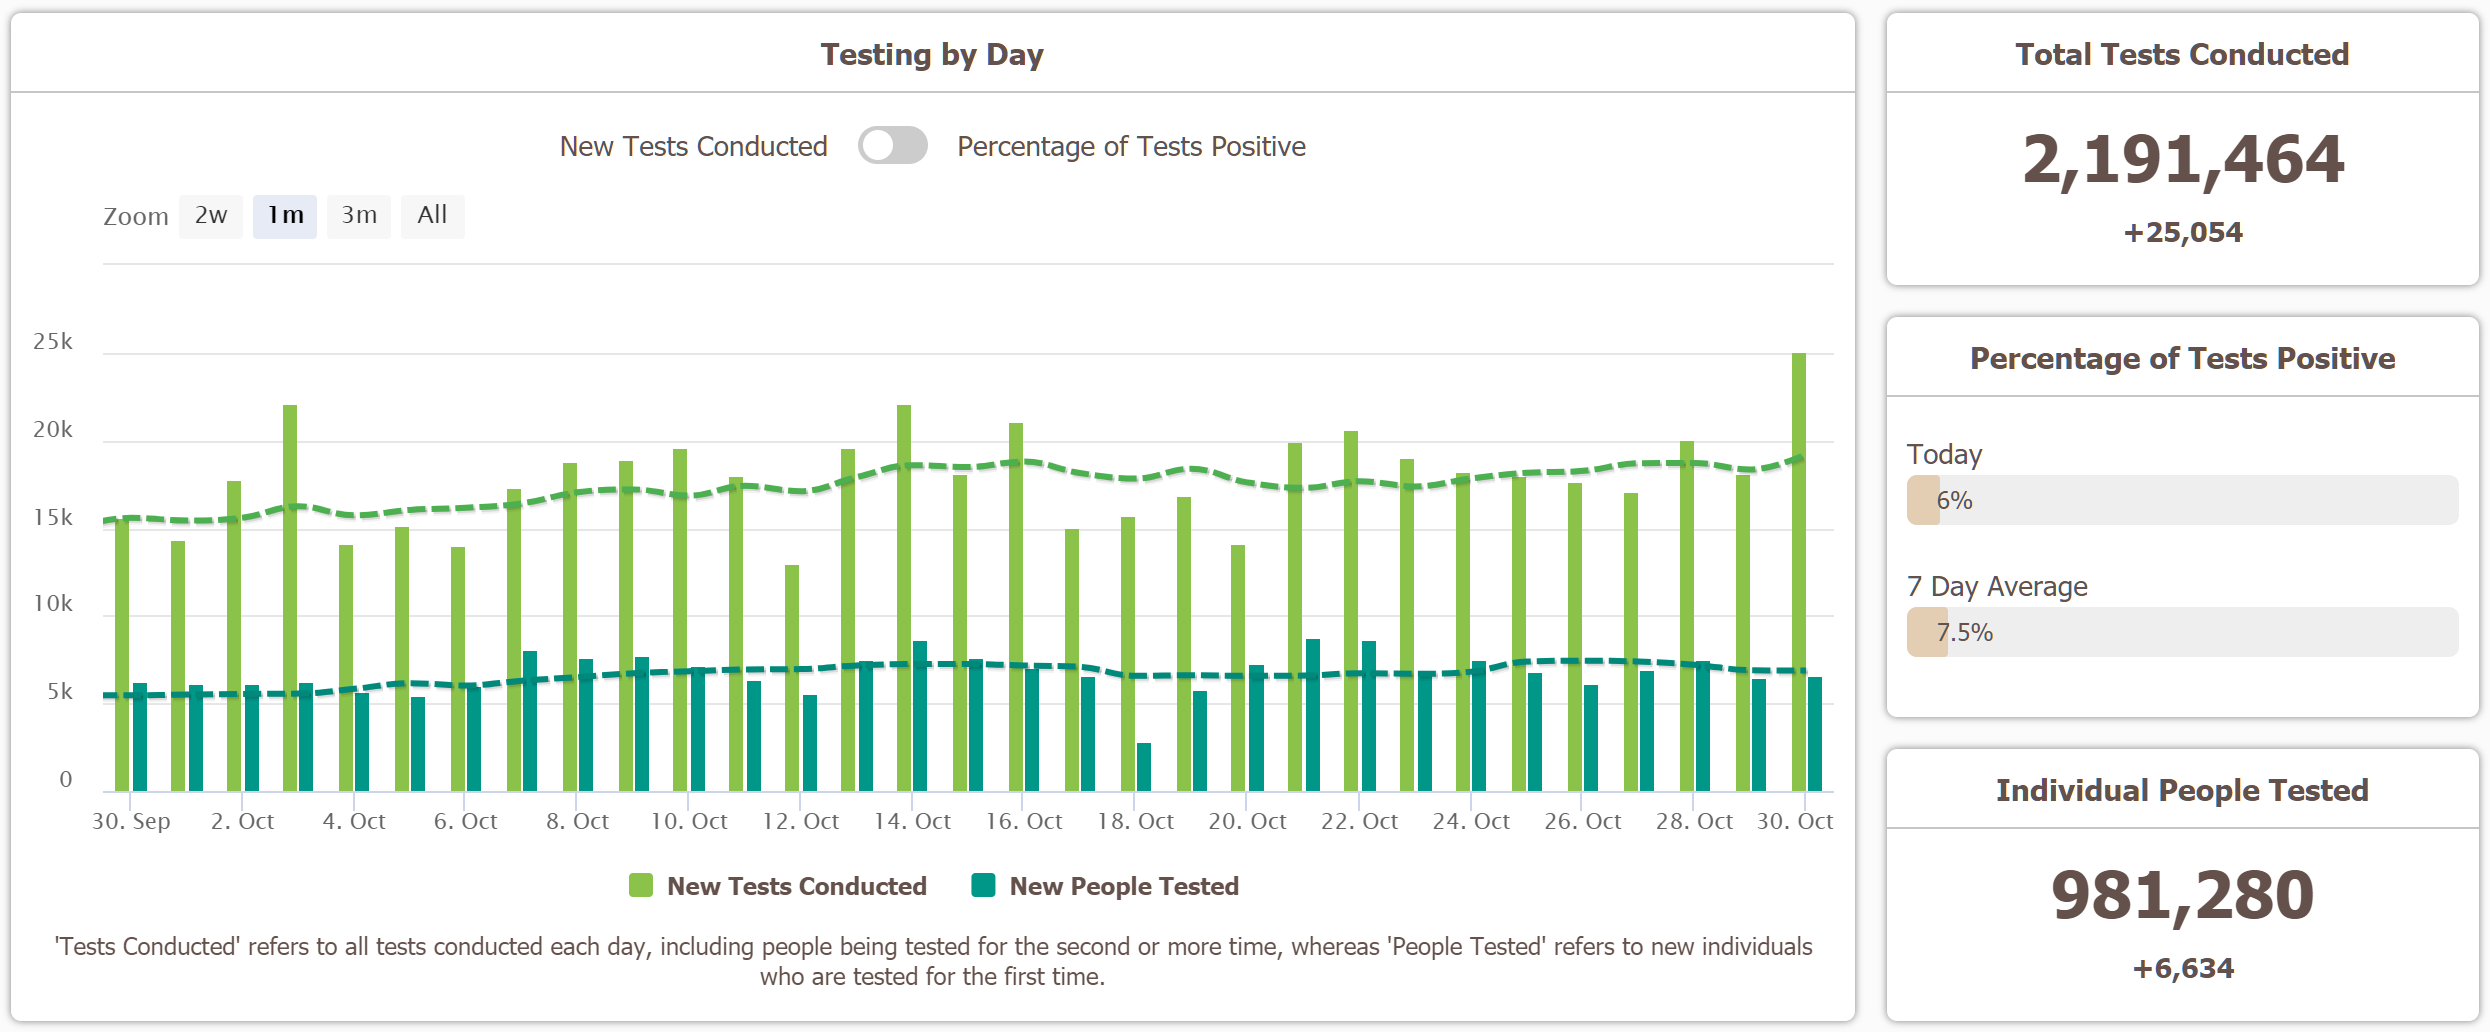
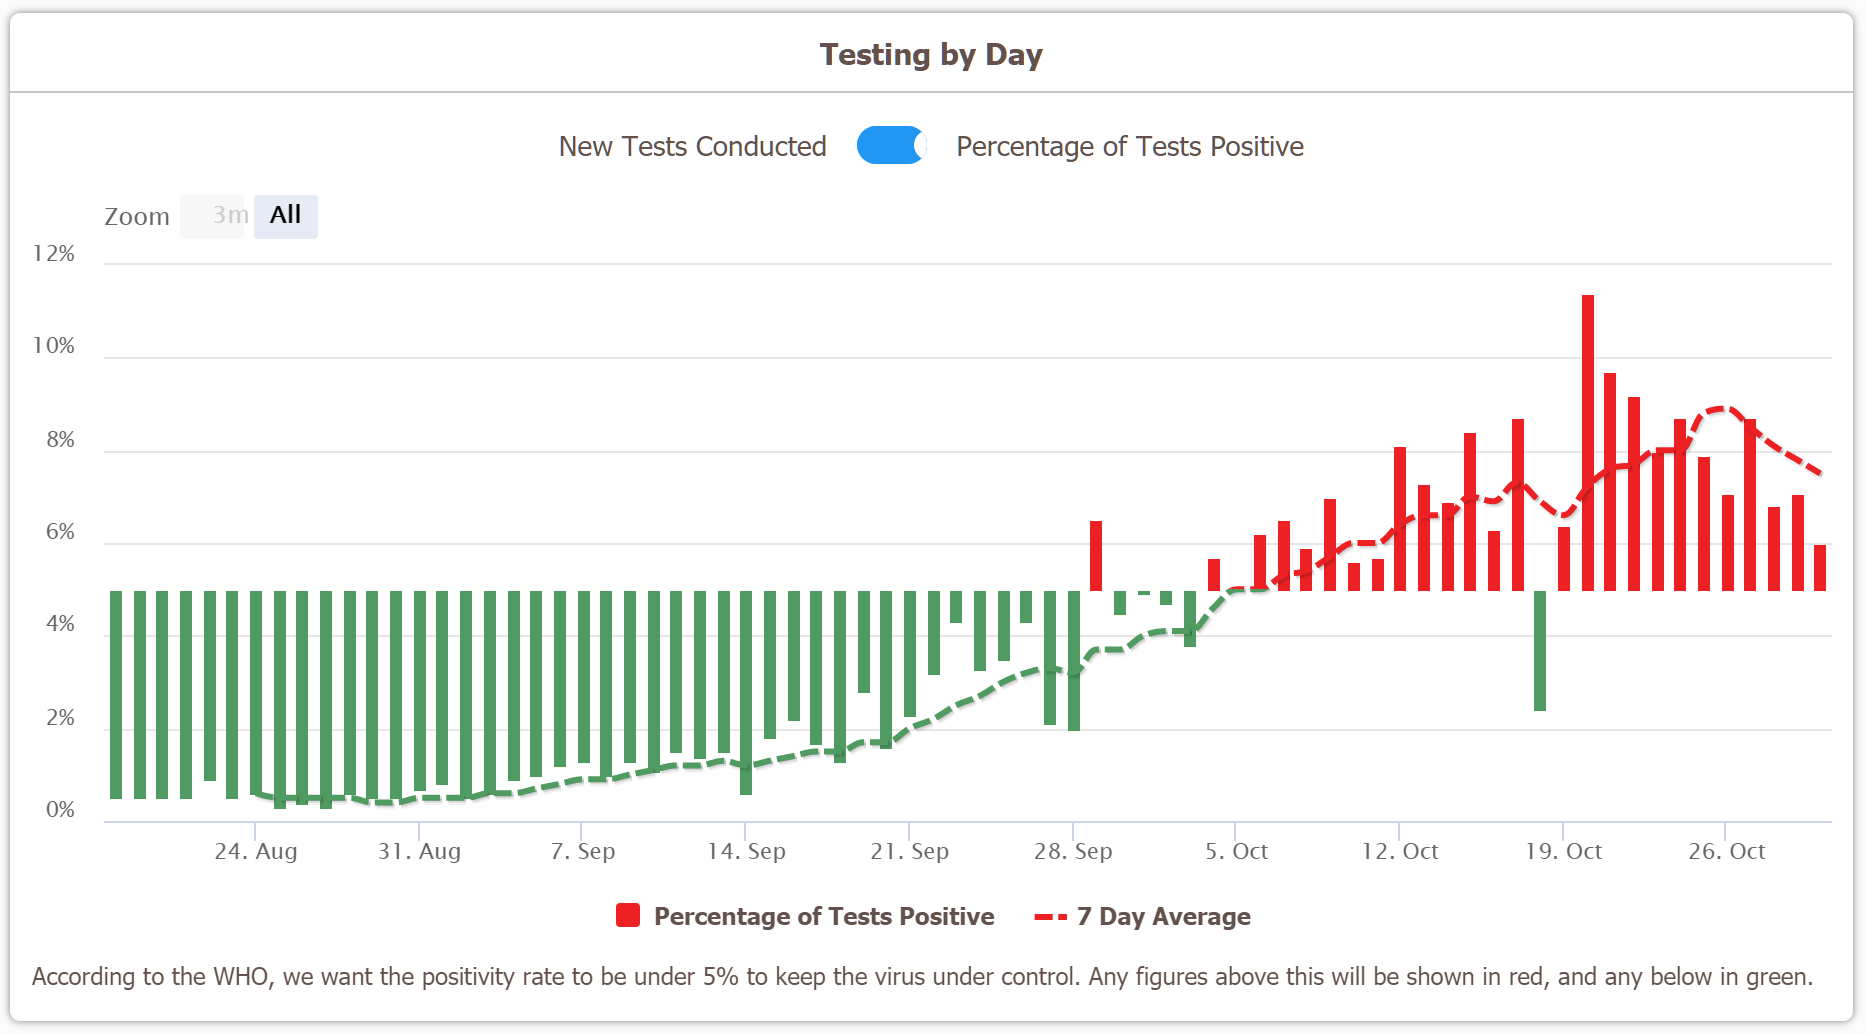
Or as the positivity rate is still increasing, that could just bee an artefact of the testing getting overwhelmed.
Cases by specimen date is more meaningful than by report date. Using data 21/9 - 25/10 (later results may not be reported yet) and applying a simple day-of-week correction the R^2 is 86% and doubling time 17.9 days.Bird on a Fire wrote: ↑Sat Oct 31, 2020 3:09 amIt's interesting that the most reliable data - hospitalisations - also has a near-perfect exponential fit based on R^2, with the more methodologically-inadequate numbers fitting more loosely.jimbob wrote: ↑Fri Oct 30, 2020 8:45 pmIt looks as though it might be slowing down. Or settling at a new slower exponential rate, possibly - hard to tellKAJ wrote: ↑Fri Oct 30, 2020 7:48 pmRegressions ln(y) v. date, data 26/9 to 30/9
y = Cases by report date
doubling time 17.1 days
slope intercept
est 0.0404 -1,775
se 0.0043 189
Rsq 72.9% 0.256 se y
---------------------
y = Patients in hospital
doubling time 12.36 days
slope intercept
est 0.0561 -2,465.94
se 0.0005 22.28
Rsq 99.6% 0.0500 se y
------------------
y = deaths by publish date
doubling time 10.51 days
slope intercept
est 0.0659 -2,903.89
se 0.0046 202.17
Rsq 81.5% 0.4537 se y
----------------------
As we expect deaths to lag patients to lag cases, does that sequence of doubling times suggest that rate of increase has reduced over the past few weeks?
Screenshot 2020-10-30 204232.png
Or as the positivity rate is still increasing, that could just bee an artefact of the testing getting overwhelmed.
Assuming no change in hospitalisation rates that's the number I'd bet money on.
Indeed. It's why I like the covid.joinzoe.com symptomatic data report. As it isn't limited by testing numbers. Serological survey results should be pretty decent now as well. You don't need too large a sample size anymore.Bird on a Fire wrote: ↑Sat Oct 31, 2020 3:09 amIt's interesting that the most reliable data - hospitalisations - also has a near-perfect exponential fit based on R^2, with the more methodologically-inadequate numbers fitting more loosely.jimbob wrote: ↑Fri Oct 30, 2020 8:45 pmIt looks as though it might be slowing down. Or settling at a new slower exponential rate, possibly - hard to tellKAJ wrote: ↑Fri Oct 30, 2020 7:48 pmRegressions ln(y) v. date, data 26/9 to 30/9
y = Cases by report date
doubling time 17.1 days
slope intercept
est 0.0404 -1,775
se 0.0043 189
Rsq 72.9% 0.256 se y
---------------------
y = Patients in hospital
doubling time 12.36 days
slope intercept
est 0.0561 -2,465.94
se 0.0005 22.28
Rsq 99.6% 0.0500 se y
------------------
y = deaths by publish date
doubling time 10.51 days
slope intercept
est 0.0659 -2,903.89
se 0.0046 202.17
Rsq 81.5% 0.4537 se y
----------------------
As we expect deaths to lag patients to lag cases, does that sequence of doubling times suggest that rate of increase has reduced over the past few weeks?
Screenshot 2020-10-30 204232.png
Or as the positivity rate is still increasing, that could just bee an artefact of the testing getting overwhelmed.
Assuming no change in hospitalisation rates that's the number I'd bet money on.
I think the issue is the limitations on test availability. As the number of cases goes up, the proportion of infected people able to get a test likely goes down.KAJ wrote: ↑Sat Oct 31, 2020 10:28 amCases by specimen date is more meaningful than by report date. Using data 21/9 - 25/10 (later results may not be reported yet) and applying a simple day-of-week correction the R^2 is 86% and doubling time 17.9 days.Bird on a Fire wrote: ↑Sat Oct 31, 2020 3:09 amIt's interesting that the most reliable data - hospitalisations - also has a near-perfect exponential fit based on R^2, with the more methodologically-inadequate numbers fitting more loosely.jimbob wrote: ↑Fri Oct 30, 2020 8:45 pm
It looks as though it might be slowing down. Or settling at a new slower exponential rate, possibly - hard to tell
Screenshot 2020-10-30 204232.png
Or as the positivity rate is still increasing, that could just bee an artefact of the testing getting overwhelmed.
Assuming no change in hospitalisation rates that's the number I'd bet money on.
That's only true if the age profile of infections is constant. But wasn't it more common in younger people back in September, and has spread to older cohorts since?Bird on a Fire wrote: ↑Sat Oct 31, 2020 12:17 pm
There isn't (yet) the same limitation on hospitalisation, so the proportion of cases serious enough to be hospitalised should be constant.
Yes, the Zoe study is useful. Their graph seems to show a steady increase in cases so far.jimbob wrote: ↑Sat Oct 31, 2020 10:56 amIndeed. It's why I like the covid.joinzoe.com symptomatic data report. As it isn't limited by testing numbers. Serological survey results should be pretty decent now as well. You don't need too large a sample size anymore.Bird on a Fire wrote: ↑Sat Oct 31, 2020 3:09 amIt's interesting that the most reliable data - hospitalisations - also has a near-perfect exponential fit based on R^2, with the more methodologically-inadequate numbers fitting more loosely.jimbob wrote: ↑Fri Oct 30, 2020 8:45 pm
It looks as though it might be slowing down. Or settling at a new slower exponential rate, possibly - hard to tell
Screenshot 2020-10-30 204232.png
Or as the positivity rate is still increasing, that could just bee an artefact of the testing getting overwhelmed.
Assuming no change in hospitalisation rates that's the number I'd bet money on.
Yes, true. We could be seeing an increase in community spread, after the initial boost from opening schools and universities.AMS wrote: ↑Sat Oct 31, 2020 12:23 pmThat's only true if the age profile of infections is constant. But wasn't it more common in younger people back in September, and has spread to older cohorts since?Bird on a Fire wrote: ↑Sat Oct 31, 2020 12:17 pm
There isn't (yet) the same limitation on hospitalisation, so the proportion of cases serious enough to be hospitalised should be constant.