The issue is that your data yesterday (and in fact for the past few days) stops at the 22nd of December, since a UK total was not being given, since not all the nations in the UK were reporting.
I however just used the totals of the nations which were reporting, since England always reported, and the nations which didn't report have like 10-20 deaths per day or something, which isn't significant enough to merit throwing the whole thing out.
<snip>
Thanks, interesting. I think this may be a part of my problem - the data sets included in "Deaths by date reported" and "Deaths by date of death" are different.
But I don't really see why. At coronavirus.data.gov.uk/details/deaths both representations have options for "UK total" and "By country" and it's UK total I'm using. Why would some deaths be included in "UK total:Deaths by date reported" but not in "UK total:Deaths by date of death"? Maybe political pressures have influence?
There's something funny about "Deaths by date reported". I've just downloaded today's version of that data as a csv file
I think I'm going to give up trying to understand the "Deaths by date reported" data or reconcile it with "Deaths by date of death". I prefer by date-of-death anyway, and this is turning into a time and effort sink with little payback in terms of insight.
The issue is that your data yesterday (and in fact for the past few days) stops at the 22nd of December, since a UK total was not being given, since not all the nations in the UK were reporting.
I however just used the totals of the nations which were reporting, since England always reported, and the nations which didn't report have like 10-20 deaths per day or something, which isn't significant enough to merit throwing the whole thing out.
<snip>
Thanks, interesting. I think this may be a part of my problem - the data sets included in "Deaths by date reported" and "Deaths by date of death" are different.
But I don't really see why. At coronavirus.data.gov.uk/details/deaths both representations have options for "UK total" and "By country" and it's UK total I'm using. Why would some deaths be included in "UK total:Deaths by date reported" but not in "UK total:Deaths by date of death", especially as the last few in the latter, but not the former, are marked as incomplete? Maybe political pressures have influence?
There's something funny about "Deaths by date reported". I've just downloaded today's version of that data as a csv file
I think I'm going to give up trying to understand the "Deaths by date reported" data or reconcile it with "Deaths by date of death". I prefer by date-of-death anyway, and this is turning into a time and effort sink with little payback in terms of insight.
The issue is that your data yesterday (and in fact for the past few days) stops at the 22nd of December, since a UK total was not being given, since not all the nations in the UK were reporting.
I however just used the totals of the nations which were reporting, since England always reported, and the nations which didn't report have like 10-20 deaths per day or something, which isn't significant enough to merit throwing the whole thing out.
<snip>
Thanks, interesting. I think this may be a part of my problem - the data sets included in "Deaths by date reported" and "Deaths by date of death" are different.
But I don't really see why. At coronavirus.data.gov.uk/details/deaths both representations have options for "UK total" and "By country" and it's UK total I'm using. Why would some deaths be included in "UK total:Deaths by date reported" but not in "UK total:Deaths by date of death"?
In this case, because if not all four nations have reported a number for that date, the UK number isn't given for that date. But you might have three out of the four nations so be close enough. And their number for that day might get filled in the next day, so really it's yesterday's data which needs to be updated rather than adding it to today's data.
But if not all four nations have reported a number for that date they report the a UK number for "Deaths by date reported" but apparently don't enter those numbers into the corresponding "Deaths by date of death", even though the latter is marked as incomplete and the former isn't.
And the concept of "yesterday's data" only applies to "Deaths by date of death". "Deaths by date reported" is defined as
Deaths by date reported - each death is assigned to the date when it was first included in the published totals.
Yesterday's data is that which was published yesterday, today's data is that published today - by definition.
Re: COVID-19
Posted: Wed Dec 30, 2020 9:12 am
by shpalman
Here are the graphs I had in mind, plotted starting from 1st September (so you can recognise the shape from the UK covid webpage) and 1st November (so you can see the effect I'm looking for).
These lines are 7-day averages, since plotting data points would make them even messier. (I also didn't try to trim the fall-off at the end of each line from "unfinished" reporting since the whole point of this graph is the question of when reporting finishes; it would have been too subjective and it's also confounded by the issue I mention at the end, that some averages end up higher if the incomplete data is cut off by a UK total not being given if all nations haven't reported a number.)
KAJ-data-1stSep.png (72.6 KiB) Viewed 4142 times
KAJ-data-1stNov.png (179.76 KiB) Viewed 4142 times
In particular, in the second graph I think you can see in the last 5-10 lines how the trend in the second half of the graph went from a slow decrease to flat to increase, with the change in gradient between the 22nd and 23rd of December.
I noticed, looking at the raw data with KAJ kindly sent me, was that not all reports had data all the way up to the day before the report date. This seems to have happened every weekend in fact. For example, the data from the 4th of December reports data up to the 3rd, but the data on the 5th and 6th also stops on the 3rd, then the data on the 7th goes all the way up to the 6th. This is probably that issue I mentioned previously, that if not all four nations in the UK report a number for the date, the UK total just isn't given, and they are filled in after the weekend. Those numbers count as being reported on the 5th or 6th even if the UK doesn't find out about them until the 7th.
I noticed, looking at the raw data with KAJ kindly sent me, was that not all reports had data all the way up to the day before the report date. This seems to have happened every weekend in fact. For example, the data from the 4th of December reports data up to the 3rd, but the data on the 5th and 6th also stops on the 3rd, then the data on the 7th goes all the way up to the 6th. This is probably that issue I mentioned previously, that if not all four nations in the UK report a number for the date, the UK total just isn't given, and they are filled in after the weekend. Those numbers count as being reported on the 5th or 6th even if the UK doesn't find out about them until the 7th.
Yes. As downloaded a single days data is in "wide" format e.g. some of the columns I downloaded yesterday:
> aDF[1:20, c(1,10:12)]
         date PubDeaths DateDeaths cumDateDeaths
1  2020-12-28       357         NA            NA
2  2020-12-27       316         NA            NA
3  2020-12-26       230         NA            NA
4  2020-12-25       570         NA            NA
5  2020-12-24       585         NA            NA
6  2020-12-23       744         NA            NA
7  2020-12-22       691        456         69818
8  2020-12-21       215        505         69362
9  2020-12-20       326        437         68857
10 2020-12-19       534        424         68420
11 2020-12-18       489        448         67996
12 2020-12-17       532        495         67548
13 2020-12-16       613        404         67053
14 2020-12-15       506        447         66649
15 2020-12-14       232        471         66202
16 2020-12-13       144        406         65731
17 2020-12-12       519        432         65325
18 2020-12-11       424        436         64893
19 2020-12-10       516        447         64457
20 2020-12-09       533        427         64010
This has one row (date) for each date for which there is any data, implying missing values (NA) where there is no data.
By the way, often (usually!) NA and zero should be treated differently. In the case of "Deaths by date-of-death" (DateDeaths) that is debatable. I read this example as meaning that no deaths have (yet!) been reported for 23-28 December. But it is recognised that DateDeaths figures may be incomplete and are subject to change in future publication date, so if NA means "none yet" then NA means zero. But that's by the way.
Moving on, I store the accumulating data (and sent it to you) in a "stacked" or "long" 3-column format. The first two columns are as published, but I omitted rows with NA for DateDeaths (as they hold no information). I added column "Published" recording which days downloads the data came from. This layout makes it easy (inter alia) to calculate how long after a given date-of-death the given number of deaths was reached; lag = Published - date.
Your comments are easiest interpreted by looking at an "unstacked" or "wide" format with data from different publication dates in different columns. This requires NA values (subject to my 'by the way' above, but also noting that date-of-death > Publication date really is NA) e.g.
        date 2020-12-07 2020-12-06 2020-12-05 2020-12-04
1 2020-12-06         53         NA         NA         NA
2 2020-12-05        142         NA         NA         NA
3 2020-12-04        231         NA         NA         NA
4 2020-12-03        346        337        294        119
5 2020-12-02        335        328        320        280
6 2020-12-01        352        350        346        325
You say "if not all four nations in the UK report a number for the date, the UK total just isn't given, and they are filled in after the weekend. Those numbers count as being reported on the 5th or 6th even if the UK doesn't find out about them until the 7th".
But I'm afraid that contradicts the definition of "Deaths by date reported" which is link
Deaths by date reported - each death is assigned to the date when it was first included in the published totals.
The numbers count as being reported on the date they are published, which cannot be before the UK finds out about them. If they are included in the "Deaths by date reported" I cannot see why they are not included in the "Deaths by date of death".
As I understand it, each death has (inter alia) three attributes:
Location
Date of death
Date of first publication (possibly blank for a time)
Location controls which collections (UK, England, Midlands, ...) include the death.
If the display is "Deaths by date of death" the summary is by that attribute, but may (should) exclude those with no date of first publication.
If the display is "Deaths by date reported" the summary is by date of first publication.
It seems almost as if coronavirus.data.gov.uk hold each death separately in separate databases for each display format. That is such bad practice that I would find it hard to believe if I hadn't worked with PHE.
Re: COVID-19
Posted: Wed Dec 30, 2020 5:11 pm
by discovolante
Does anyone know roughly how this new version of the virus is mostly being transmitted? Huge increase in Scotland in the last week from about 17 identified cases to now nearly 43% of over 2000 cases today. Still seems to be a bit soon for the Christmas effect, but I think schools were left open for about a week after it was all change for Christmas and she announced higher restrictions from Boxing day (bit of a misstep there really....). So I'm guessing still schools with some pre Christmas mingling but I'm just speculating really.
Re: COVID-19
Posted: Wed Dec 30, 2020 5:27 pm
by KAJ
Over the last few weeks the rise in cases by specimen date is well described (R-sq = 95%) by simple exponential growth (with a day-of-week offset).
At 29/12 fit = 59349.1 with doubling time = 15.6 days.
So, 50023 new cases in the UK reported today, which means that either yesterday's high number wasn't due entirely to clearing a backlog of reports and/or that the backlog isn't finished with.
981 deaths, most of which date from the Christmas period but quite a few from the previous week too.
@KAJ: Here are the numbers for the deaths (by date reported) in the UK which I'd been taking from the top of https://coronavirus.data.gov.uk/details/deaths and adding to my spreadsheet every evening:
Date		Daily	UK Total
30-12-2020	981	72548
29-12-2020	458	71567
28-12-2020	357	71109
27-12-2020	316	70752
26-12-2020	230	70436
25-12-2020	570	70206
24-12-2020	585	69636
23-12-2020	744	69051
And here are the numbers as they appear on that page right now under the Data tab of Deaths within 28 days of positive test by date reported - UK Total
Date		Daily	UK Total
30-12-2020	981	72548
29-12-2020	414	71567
28-12-2020	357	71153
27-12-2020	317	70796
26-12-2020	230	70479
25-12-2020	613	70249
24-12-2020	585	69636
23-12-2020	744	69051
So whatever the correct definition of "by date reported", they are correcting previous numbers. They quietly moved 43 deaths from yesterday's total to Christmas day, and one from yesterday to the 27th. During the holidays things were probably a bit disorganized.
Of course if nobody actually gave those numbers in here at the time we don't have proof of that, I could always have typed the wrong daily total into my spreadsheet (but I do always check that it matches the new daily increment). So I can only hope to actually catch it happening over New Year.
Re: COVID-19
Posted: Wed Dec 30, 2020 6:20 pm
by shpalman
I was hoping to find some evidence on the Guardian live blog from previous days, but I found this from the 28th of December
The government said a further 357 people had died across the UK within 28 days of testing positive for Covid-19 as of Monday, bringing the UK total to 71,109.
<snip>
So whatever the correct definition of "by date reported", they are correcting previous numbers. They quietly moved 43 deaths from yesterday's total to Christmas day, and one from yesterday to the 27th. During the holidays things were probably a bit disorganized.
Of course if nobody actually gave those numbers in here at the time we don't have proof of that, I could always have typed the wrong daily total into my spreadsheet (but I do always check that it matches the new daily increment). So I can only hope to actually catch it happening over New Year.
Yes, as I said above I'm not particularly interested in deaths by report date. But storing that data is only a few lines...
local({
Published <- max(aDF$date) # current data publication date
temp <- aDF[,c("date", "PubDeaths")]  # current PubDeaths data
aggDF <- readRDS("cPDeaths.rds")  # read PubDeaths aggregate
if(Published > max(aggDF$Published)) { # if new data
  temp$Published <- Published # Published col
  aggDF <- rbind(aggDF, na.omit(temp)) # append to aggregate
  saveRDS(aggDF, "cPDeaths.rds") # save PubDeaths aggregate
  print(paste0("Added PubDeaths: ", Published))
  }
  })
... in the R Markdown notebook I run every day, so I'll have it in future if you want.
Oh, and "Weekly deaths with COVID-19 on the death certificate by date registered" is also starting to go up again.
Looking at the last month I'd take some convincing ...
Screenshot 2020-12-30 at 19.18.09.png (10.48 KiB) Viewed 4023 times
... especially as
The data are published weekly by the ONS, NRS and NISRA and there is a lag in reporting of at least 11 days because the data are based on death registrations.
Re: COVID-19
Posted: Thu Dec 31, 2020 3:14 pm
by jimbob
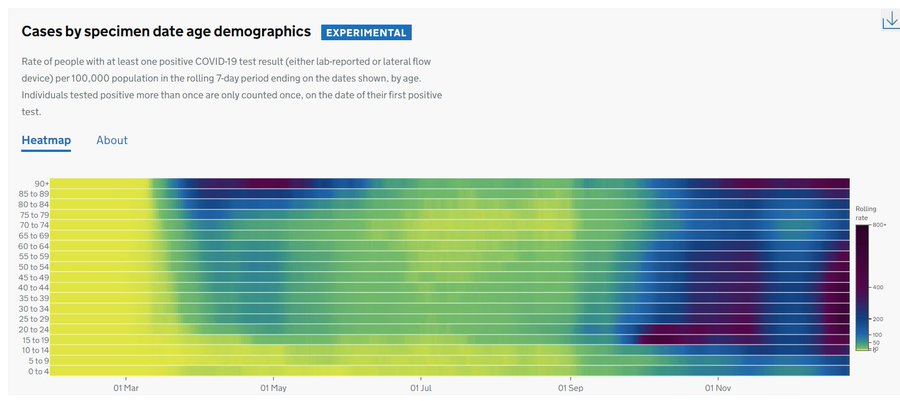
The age heatmap for England (other UK nations don't seem to have the data shows the impact of lockdown, and the picking up afterwards across almost all ages
The age heatmap for England (other UK nations don't seem to have the data shows the impact of lockdown, and the picking up afterwards across almost all ages
It's becoming apparent that there's an exponential increase in death rate going on, starting about three weeks ago.
ending-2020-in-the-sh.t.png
I'm not convinced, see below. Models don't fit well, but there really isn't much evidence (even visual) of a consistent increase. By date of death (last 5 zero weighted, day-of-week doesn't help fit)
The age heatmap for England (other UK nations don't seem to have the data shows the impact of lockdown, and the picking up afterwards across almost all ages
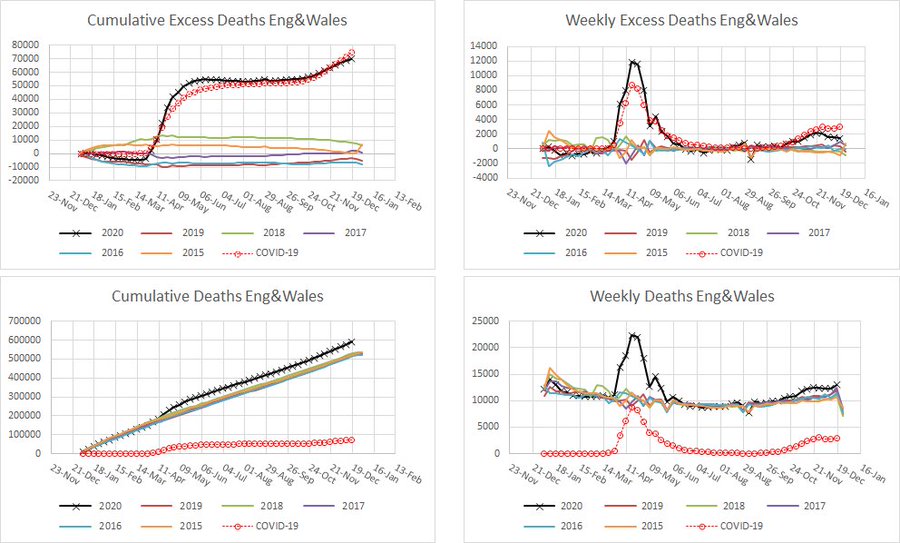
What the Week 51 ONS data looks like for England and Wales:
The apparent anomaly in weekly excess deaths 21 Nov to 19 Dec where Covid deaths are higher than excess deaths is explained by very low levels of influenza this winter (presumably due to the lockdown). Non-Covid deaths are lower than usual.
Re: COVID-19
Posted: Fri Jan 01, 2021 10:57 am
by JellyandJackson
And today in local muppetry:
Police break up New Year's Eve parties in virus hotspot Essex.
In Essex, which has some of the highest localised infection rates in the UK, police said they broke up three unlicensed parties and issued £18,000 of fines.
Officers said they had objects thrown at them and threats were made as they tried to break up a party where revellers had gained entry to a church. The crowd was eventually dispersed before midnight and three people were arrested on drugs charges, with two of them also arrested under the coronavirus regulations.
About 100 people were cleared from an abandoned warehouse in Brentwood that was the venue for another unlicensed party.
And a woman was fined £10,000 for organising a house party with about 100 attendees. Equipment was seized and about 25 fines were given to partygoers.
Assistant Chief Constable Andy Prophet thanked those people who stayed at home but added: "Unfortunately, there were others who decided to blatantly flout the coronavirus rules and regulations and, ultimately, they decided that partying was more important than protecting other people."
Our hospitals are really struggling, all leave is cancelled, major incident declared, all that, and this is what the locals do.
What the Week 51 ONS data looks like for England and Wales:
The apparent anomaly in weekly excess deaths 21 Nov to 19 Dec where Covid deaths are higher than excess deaths is explained by very low levels of influenza this winter (presumably due to the lockdown). Non-Covid deaths are lower than usual.
Indeed. And although influenza is highly important, there are lots of other infectious diseases that have also fallen. Including, (IIRC from earlier) ones that might seem surprising, like food poisoning.
In a really rather peculiar turn events, non-COVID winter deaths are negative for the first time ever. In other words, there is apparently less death this winter than you would usually expect during the summer. That's 2020 for you. Happy New Year!
Re: COVID-19
Posted: Fri Jan 01, 2021 12:16 pm
by jimbob
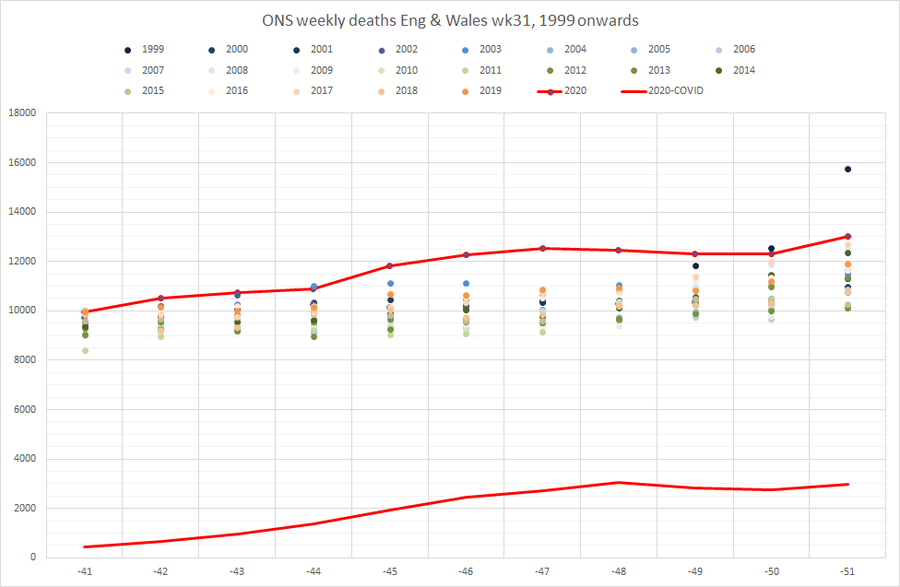
And this is actually what the ten weeks looks like compared to 1999 onwards:
Re: COVID-19
Posted: Fri Jan 01, 2021 1:29 pm
by Little waster
I assume I missed the memo. When did the smiley emoji become the symbol of “the Resistance*”?
Presumably the poo emoji had already been taken?
*so called because during the Second World War thousands of brave free-thinkers in occupied Europe declared the Nazi occupation a hoax and to prove it was spent every day handing over downed Allied pilots to the authorities and informing on their neighbours if they did anything subversive.