Re: COVID-19
Posted: Wed Oct 13, 2021 11:42 pm
I would like to blame Cummings for it.
Bêtes theorem and social media does explain what is happening in most of the country. Especially as the more testing is going on in secondaries and the higher the prevalance is the more you’d expect to see. Some areas of the SW are completely atypical though. Here’s a thread with some data from the 9 ‘suspicious areas’ in the SW. https://mobile.twitter.com/ArtySmokesPS ... 0837458949raven wrote: ↑Wed Oct 13, 2021 3:58 pmBack to the +ve LFT, -ve PCR for a moment.
I like his diagram, much easier to see how the percentages shake out from a picture.jdc wrote: ↑Sun Oct 10, 2021 4:52 pmCouple of additional suggestions from Kit Yates - increased reporting, people faking a positive LFT result, or changes in test accuracy due to vaccination or demographic infected. (He also thinks faulty tests and new variant are possible explanations.)
More here, including a diagram based on 1% prevalence https://twitter.com/Kit_Yates_Maths/sta ... 6328343552
Kit Yates on Twitter PCR & LFT %.png
So, very roughly, for every 25 people with a +ve LFT, about 24 people really have Covid, and 1 doesn't. But 2 of those 25 people will have a subsequent -ve PCR, and we won't know which of them is infected.
I'm sure that he's right and there'll be a positive feedback loop of people reporting this on social media getting responses from other people it's happened to. But I don't know that it seems likely enough from those % to account for it happening to multiple people in the same family though.
If what I read yesterday online is accurate....
It's possible the LFT might be picking up another corona virus because the LFTs have been checked against 3 of the 4 common ones here and don't pick them up, but the 4th is too hard to grow in vitro so hasn't been checked & might be the issue.
Our PCR tests usually look at 3 points of RNA, so it seems unlikely a new variant would read as completely negative. You'd be more likely to see a drop out on one test-point I think, like there's been for variants before -- Delta iirc -- and that still counts as positive. Plus I think we're still doing a fair bit of sequencing from PCRs so I'd hope a new variant would get picked up that way.
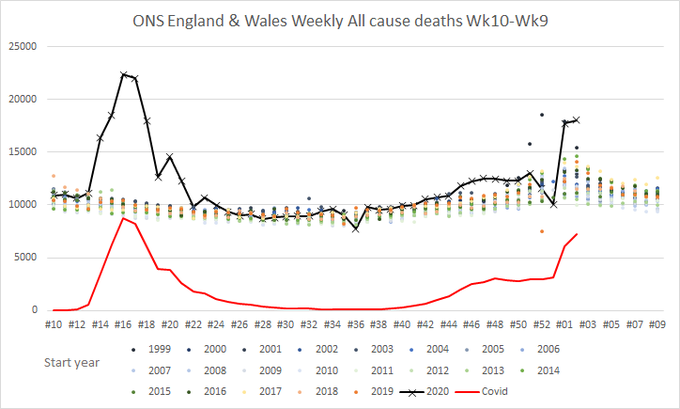
sheldrake wrote: ↑Wed Oct 13, 2021 10:33 pm1) 'Excess deaths' depend on what you take as a 'normal' level of deaths. Previous 5 years we had unusually low age-adjusted mortality compared to the norms going back to 1990. You can't assume that all, or even most, deaths above the previous 5-year average were really the result of untested Covid.shpalman wrote: ↑Wed Oct 13, 2021 10:10 pmSo for example the worst week in the first wave was that of the 17th of April in which there were 21144 deaths when normally about 10000 would have been expected; only about 8000 were even attributed to covid on the death certificate, but there were only about 5000 deaths per week in the covid stats just because someone won't count as a covid death unless they tested positive for covid, and the testing capacity just wasn't there yet. So yeah some of those tens of thousands of deaths might have been avoided by locking down earlier.
Well, there's whether or not covid was mentioned on the death certificate. But you can't really go by hospital admissions either, since in the first wave older people quickly went from "seem to be doing fine" to "too late to do anything" and there wasn't really considered much point in taking them to hospital. Doctors didn't really know what to do except prone intubation and older patients were considered not strong enough to survive it. Survival rates in intensive care were about 50% at that stage. They've since developed better protocols and with fewer patients being admitted have the chance to actually apply them.sheldrake wrote: ↑Wed Oct 13, 2021 10:33 pm2) Deaths that occur even when somebody tests positive to Covid aren't necessarily primarily caused by Covid. I think the cause of admission to hospital (e.g. admitted for Covid, or unknown respiratory) would be the best thing to look at, don't know if it's possible to dig that out.
No, I've only seen annual age-adjusted death data. 2020 was below the norms for 2008 and every year going back to 1990 though.
I think this has to be balanced against the fact that people asking to see a doctor are likely to be sick with something else requiring treatment. Covid is far from the only thing that can kill you, and it's not even the most likely condition to kill most people. This is one of the dangers of the single-frame focus I talked about.It's a similar balancing act with visiting patients at home & cutting down on face-to-face GP appointments - it's not just the risk to that GP getting sick, or the resulting loss of staff hours to the practise, it's also the risk of transmission to subsequent patients in that infectious yet-not-symptomatic interval.
Their analysis doesn't really give a cause for the changes in mortality over time, it just notes they're happening. The age-adjusted mortality was higher as recently as 2008 - is there really strong evidence that this is all due to lifestyle changes and the last 5 years represent a 'new normal', or could it be that the last 5 years just had coincidentally low mortality due to different flu strains, or an increase in flu vaccine uptake etc.. etc.. ?6) On death rate back to 1990, you might want to look at what the ONS say about their own data. See here, and here and here.
tl, dr version: deaths fell from 1990 to 2010 because of ongoing improvements in lifestyle/health (mostly men's life expectancy catching up with womens I think). That trend slowed after 2010, and in fact as a straight number deaths rose from 2015, perhaps because of 'flu, or austerity. So comparing 2020 to the last five years makes some sense.
No, I'm looking at the link I posted earlier which shows age adjusted deaths per capita, in which 2020 is just a return to 2009 levels and still lower than all previous years to 1990shpalman wrote: ↑Thu Oct 14, 2021 6:46 pmI assume you're looking at the Annual deaths and mortality rates, 1838 to 2020 (provisional) spreadsheet.
There's some discussion of people in the SW testing negative from drive through PCRs but positive via postal. Might the mega labs take all the postal stuff for example? Obviously testing again later during the course of the illness might mean higher viral load at that point.raven wrote: ↑Thu Oct 14, 2021 4:08 pm@Woodchopper & OffTheRock -
Yes, it does look like it's a testing issue. I don't know if all the PCR labs use the three-point test - iirc at one point some were using a 2point one, so I wondered if it might be that. Definitely looks like something pretty dramatic is happening, whether it's at the lab stage or the swabbing stage. Do all the SW swabs go to one lab though? I thought the mega labs at Leamington & Milton Keynes took samples from all over.
It's the same numberssheldrake wrote: ↑Thu Oct 14, 2021 7:00 pmNo, I'm looking at the link I posted earlier which shows age adjusted deaths per capita, in which 2020 is just a return to 2009 levels and still lower than all previous years to 1990shpalman wrote: ↑Thu Oct 14, 2021 6:46 pmI assume you're looking at the Annual deaths and mortality rates, 1838 to 2020 (provisional) spreadsheet.
https://www.ons.gov.uk/aboutus/transpar ... 51wKzm7uiQ
The spreadsheets at the weekly deaths link I posted do that.
Look at the plot I've posted where it's not just deaths, but age adjusted per-capita. Less dramatic looking, wouldn't you say? Remember life in 2008, 2005? You probably don't remember it being a frightening time requiring urgent govt. intervention in people's daily lives or unusual measures to try and strong-arm them into taking medications. More death then though, just less media hysteria.
Sure. I still don't think that's a good way to analyse this, for the reasons I gave a few posts ago.
Thissheldrake wrote: ↑Thu Oct 14, 2021 7:14 pmLook at the plot I've posted where it's not just deaths, but age adjusted per-capita. Less dramatic looking, wouldn't you say? Remember life in 2008, 2005? You probably don't remember it being a frightening time requiring urgent govt. intervention in people's daily lives or unusual measures to try and strong-arm them into taking medications. More death then though, just less media hysteria.
What's not a good way to analyse this? Tables 12a-c and 13a-c in this excel spreadsheet at the weekly deaths link I posted, which break down causes of death?
Trevor Bedford
@trvrb
·
13 Oct
I've meaning to write a "COVID endgame" thread for a while and I apologize this is somewhat delayed compared to media interviews like https://science.org/content/article/wil ... mark-clues
and https://statnews.com/2021/09/20/winter- ... son-looms/ and to recent seminars like https://youtube.com/watch?v=VErVD_H1BZ0
. 1/17
shpalman wrote: ↑Thu Oct 14, 2021 8:54 pm
Look at the plot I've posted where it's not just deaths, but age adjusted per-capita. Less dramatic looking, wouldn't you say? Remember life in 2008, 2005? You probably don't remember it being a frightening time requiring urgent govt. intervention in people's daily lives or unusual measures to try and strong-arm them into taking medications. More death then though, just less media hysteria.
Yes, but it's a tiny uptick that still looks like 'normal for 2009'. I don't remember 2009 being a particularly scary year, do you ?Bear in mind that uptick in deaths was despite locking down hard (if late).
I beg to differ. We do have countries and US states to look at where there was no govt. mandated lockdown (and by lockdown, I'm talking about the kind of intense measures we saw in the UK, or Australia, not what they did in Sweden, which is routinely cited as an example of 'not locking down' despite having a rule of 8 in restaurants etc.. for a brief period).None of us can really predict how bad things could have been without a government-mandated lockdown (people would have reacted anyway)
I wouldn't say anything that dismissive of human life. I would simply say that what we've seen in 2020 was no more severe than what we considered 'normal' in 2009, or 'less severe than normal' for most preceeding years. It may be that there were multiple flu strains or other health problems at work in the population before 2009 that we were comfortable largely ignoring whereas this disease, which seems a less dangerous than driving, or junk food, has provoked a panicked reaction that's being used as a wedge to introduce mandatory digital IDs and travel restrictions etc..Or maybe your assertion that the death rate has been a bit low over the past few years is implying that some people have already lived longer than they should have
'Follow the trend' doesn't sit well with me yet because in 30 years of data, it could be 2010-2019 which are an abnormal quiet spot as far as various pathogens or other common causes of death go.What's not a good way to analyse this?
If age adjusted mortality was falling before 2010 and rising after 2010, given that age only increases at 1 year per year, then something needs explaining.sheldrake wrote: ↑Thu Oct 14, 2021 11:01 pmPlease stop treating Guardian political editorial as scientifically useful. This is obviously nonsense. The social sciences are full of ideologically obsessive morons who treat simple chronological sequencing of a few variables as evidence of causality. Age-adjusted mortality was even higher before 2010. Austerity doesn't explain that.
Absolutely, but that article was an extremely shallow, facile analysis of the kind that people who've started with a conclusion based on their own biases and then work backwards to try and make reality fit them would do. It's transparent politicking. There are a large number of possible explanations for mortality falling before 2010 and then flattening out, which the study did not evaluate. It's pretty much on a par with the old 'Global temps are rising because the number of pirates has gone down' joke. You all know we can do better than that.
"A mind so open that reason has fallen out"sheldrake wrote: ↑Thu Oct 14, 2021 11:31 pmAbsolutely, but that article was an extremely shallow, facile analysis of the kind that people who've started with a conclusion based on their own biases and then work backwards to try and make reality fit them would do. It's transparent politicking. There are a large number of possible explanations for mortality falling before 2010 and then flattening out, which the study did not evaluate. It's pretty much on a par with the old 'Global temps are rising because the number of pirates has gone down' joke. You all know we can do better than that.
Age-adjusted mortality was falling, and then it stopped falling.sheldrake wrote: ↑Thu Oct 14, 2021 11:01 pmPlease stop treating Guardian political editorial as scientifically useful. This is obviously nonsense. The social sciences are full of ideologically obsessive morons who treat simple chronological sequencing of a few variables as evidence of causality. Age-adjusted mortality was even higher before 2010. Austerity doesn't explain that.
* - "middle-layer super output areas"In 2002–06 and 2006–10, all but a few (0–1%) MSOAs* had a life expectancy increase for female and male sexes. In 2010–14, female life expectancy decreased in 351 (5·2%) of 6791 MSOAs. By 2014–19, the number of MSOAs with declining life expectancy was 1270 (18·7%) for women and 784 (11·5%) for men. The life expectancy increase from 2002 to 2019 was smaller in MSOAs where life expectancy had been lower in 2002 (mostly northern urban MSOAs), and larger in MSOAs where life expectancy had been higher in 2002 (mostly MSOAs in and around London). As a result of these trends, the gap between the first and 99th percentiles of MSOA life expectancy for women increased from 10·7 years (95% credible interval 10·4–10·9) in 2002 to reach 14·2 years (13·9–14·5) in 2019, and for men increased from 11·5 years (11·3–11·7) in 2002 to 13·6 years (13·4–13·9) in 2019.
Interpretation
In the decade before the COVID-19 pandemic, life expectancy declined in increasing numbers of communities in England. To ensure that this trend does not continue or worsen, there is a need for pro-equity economic and social policies, and greater investment in public health and health care throughout the entire country.
"Tiny uptick"? Sounds like something Boris would say while being indiscreet.
https://www.bbc.com/news/live/uk-58922518NHS Test and Trace has suspended testing operations provided by Immensa Health Clinic Ltd at its laboratory in Wolverhampton.
It follows an investigation into reports of people receiving negative PCR test results after testing positive with a lateral flow test.
Investigations are under way into the precise cause but NHS Test and Trace estimates that around 400,000 samples have been processed through the lab.
The vast majority of these will have been negative results, but an estimated 43,000 people may have been given incorrect negative PCR test results between 8 September and 12 October, mostly in south-west England.