Get your science fix here: research, quackery, activism and all the rest
-
badger
- Fuzzable
- Posts: 264
- Joined: Tue Nov 12, 2019 3:23 pm
Post
by badger » Mon Nov 23, 2020 12:17 pm
I can't see the numbers on Y-axes on those graphs - the images are too grainy and no amount of zooming and squinting makes them readable.
Is my screen on the blink? Or, as I'm assuming, are the numbers intentionally blurred as she wants people to look at the 'discrepancy' in the graph, and not at the axes?
-
sTeamTraen
- After Pie
- Posts: 2558
- Joined: Mon Nov 11, 2019 4:24 pm
- Location: Palma de Mallorca, Spain
Post
by sTeamTraen » Mon Nov 23, 2020 1:19 pm
badger wrote: ↑Mon Nov 23, 2020 12:17 pm
I can't see the numbers on Y-axes on those graphs - the images are too grainy and no amount of zooming and squinting makes them readable.
Is my screen on the blink? Or, as I'm assuming, are the numbers intentionally blurred as she wants people to look at the 'discrepancy' in the graph, and not at the axes?
It's almost as if she's not interested in communicating accurate data.
Something something hammer something something nail
-
jimbob
- Light of Blast
- Posts: 5296
- Joined: Mon Nov 11, 2019 4:04 pm
- Location: High Peak/Manchester
Post
by jimbob » Mon Nov 23, 2020 10:34 pm
Woodchopper wrote: ↑Mon Nov 23, 2020 11:23 am
Yes, I was arguing with an anti-lockdown person over the summer. When asked what was behind the spike in excess deaths across Western Europe his reply was that all the people were being killed by the lockdowns themselves.
This is my plot of the excess death numbers vs COVID-19 death numbers. And then the non-covid excess death numbers against COVID-19 deaths.
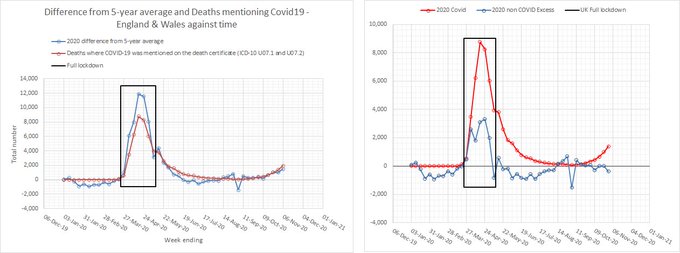
With the full-lockdown period shown. I do have the weekly all deaths data for England & Wales from wk 31, 1999 if anyone wants it.
I struggle to think of any mechanism where deaths due to lockdown wouldn't get worse as lockdown progressed - as opposed to tracking COVID-19 deaths.
There is the fact that after 5-weeks into the peak, death certificates then started getting more accurate - as for example silent hypoxia was recognised.
Have you considered stupidity as an explanation
-
jimbob
- Light of Blast
- Posts: 5296
- Joined: Mon Nov 11, 2019 4:04 pm
- Location: High Peak/Manchester
Post
by jimbob » Mon Nov 23, 2020 10:55 pm
badger wrote: ↑Mon Nov 23, 2020 12:17 pm
I can't see the numbers on Y-axes on those graphs - the images are too grainy and no amount of zooming and squinting makes them readable.
Is my screen on the blink? Or, as I'm assuming, are the numbers intentionally blurred as she wants people to look at the 'discrepancy' in the graph, and not at the axes?
That was my observation too.
Have you considered stupidity as an explanation
-
JQH
- After Pie
- Posts: 2144
- Joined: Mon Nov 11, 2019 3:30 pm
- Location: Sar Flandan
Post
by JQH » Tue Nov 24, 2020 1:22 pm
badger wrote: ↑Mon Nov 23, 2020 12:17 pm
I can't see the numbers on Y-axes on those graphs - the images are too grainy and no amount of zooming and squinting makes them readable.
Is my screen on the blink? Or, as I'm assuming, are the numbers intentionally blurred as she wants people to look at the 'discrepancy' in the graph, and not at the axes?
Don't think it's your screen, I have the same problem.
And remember that if you botch the exit, the carnival of reaction may be coming to a town near you.
Fintan O'Toole


