COVID-19

Discussions about serious topics, for serious people
Locked
User avatar
shpalman
Princess POW
Posts: 8266
Joined: Mon Nov 11, 2019 12:53 pm
Location: One step beyond
Contact:

Re: COVID-19

Post by shpalman » Thu Dec 17, 2020 10:56 am

KAJ wrote:
Wed Dec 16, 2020 9:34 pm
shpalman wrote:
Wed Dec 16, 2020 9:14 pm
To get a line which makes physical sense you need a model of the underlying physical process.
I'm not looking for a line which makes physical sense. I'm just looking for a (relatively) simple and interpretable description of the data.
A straight line on a semilog plot is a "(relatively) simple and interpretable description of the data" which makes physical sense, because epidemics grow exponentially (at least, at the beginning, with no measures to reduce transmission). This is because the number of people getting newly infected is proportional to the number of people already infected (i.e. the rate of change of the value is proportional to the value). The gradient of that line will give you the exponential time constant, from which you can get the doubling (or halving) time if you prefer.

All you can do when you make the line not-straight is look at how the gradient of it changes. The gradient over any short-enough period that it looks sort of straight will give you the exponential time constant at that moment, and of course you can see if it's exponential growth or decay by whether it's going up or down.

If you need to make a second-order (quadratic) fit to the log of the data (in the sense that either a linear fit no longer fits, or a quadratic fit unambiguously gives a non-zero coefficient for the quadratic term) then you can also see analytically how the gradient of the line is changing with time and when the peak was. As if you couldn't see it just by looking.

As you go to higher and higher orders of fit, bear in mind that the polynomials are a complete set so you could describe literally any function with them.

The usual physical model of an epidemic is the SIR, but that peaks when infection has reached a substantial fraction of the whole population, and that's not what's happening here. Also, you'd need to model that people are exposed before they become infectious, and that known infected people are quarantined, but there are lots of unknown infectious people. James Annan's model tries to take into account the fraction of infections which are actually detected, for example. But then - what? You'd be able to predict a little bit into the future assuming the lockdown rules aren't changed and/or people don't change their behaviour.
having that swing is a necessary but not sufficient condition for it meaning a thing
@shpalman@mastodon.me.uk

User avatar
jimbob
Light of Blast
Posts: 5296
Joined: Mon Nov 11, 2019 4:04 pm
Location: High Peak/Manchester

Re: COVID-19

Post by jimbob » Thu Dec 17, 2020 12:53 pm

shpalman wrote:
Thu Dec 17, 2020 10:56 am
KAJ wrote:
Wed Dec 16, 2020 9:34 pm
shpalman wrote:
Wed Dec 16, 2020 9:14 pm
To get a line which makes physical sense you need a model of the underlying physical process.
I'm not looking for a line which makes physical sense. I'm just looking for a (relatively) simple and interpretable description of the data.
A straight line on a semilog plot is a "(relatively) simple and interpretable description of the data" which makes physical sense, because epidemics grow exponentially (at least, at the beginning, with no measures to reduce transmission). This is because the number of people getting newly infected is proportional to the number of people already infected (i.e. the rate of change of the value is proportional to the value). The gradient of that line will give you the exponential time constant, from which you can get the doubling (or halving) time if you prefer.

All you can do when you make the line not-straight is look at how the gradient of it changes. The gradient over any short-enough period that it looks sort of straight will give you the exponential time constant at that moment, and of course you can see if it's exponential growth or decay by whether it's going up or down.

If you need to make a second-order (quadratic) fit to the log of the data (in the sense that either a linear fit no longer fits, or a quadratic fit unambiguously gives a non-zero coefficient for the quadratic term) then you can also see analytically how the gradient of the line is changing with time and when the peak was. As if you couldn't see it just by looking.

As you go to higher and higher orders of fit, bear in mind that the polynomials are a complete set so you could describe literally any function with them.

The usual physical model of an epidemic is the SIR, but that peaks when infection has reached a substantial fraction of the whole population, and that's not what's happening here. Also, you'd need to model that people are exposed before they become infectious, and that known infected people are quarantined, but there are lots of unknown infectious people. James Annan's model tries to take into account the fraction of infections which are actually detected, for example. But then - what? You'd be able to predict a little bit into the future assuming the lockdown rules aren't changed and/or people don't change their behaviour.
Yup - and you end up trying to reinvent the whole field of epidemiology. The simpler your analysis - the more you can understand its limitations.
Have you considered stupidity as an explanation

KAJ
Fuzzable
Posts: 310
Joined: Thu Nov 14, 2019 5:05 pm
Location: UK

Re: COVID-19

Post by KAJ » Thu Dec 17, 2020 3:38 pm

shpalman wrote:
Thu Dec 17, 2020 10:56 am
KAJ wrote:
Wed Dec 16, 2020 9:34 pm
shpalman wrote:
Wed Dec 16, 2020 9:14 pm
To get a line which makes physical sense you need a model of the underlying physical process.
I'm not looking for a line which makes physical sense. I'm just looking for a (relatively) simple and interpretable description of the data.
A straight line on a semilog plot is a "(relatively) simple and interpretable description of the data" which makes physical sense, because epidemics grow exponentially (at least, at the beginning, with no measures to reduce transmission). This is because the number of people getting newly infected is proportional to the number of people already infected (i.e. the rate of change of the value is proportional to the value). The gradient of that line will give you the exponential time constant, from which you can get the doubling (or halving) time if you prefer.

All you can do when you make the line not-straight is look at how the gradient of it changes. The gradient over any short-enough period that it looks sort of straight will give you the exponential time constant at that moment, and of course you can see if it's exponential growth or decay by whether it's going up or down.

If you need to make a second-order (quadratic) fit to the log of the data (in the sense that either a linear fit no longer fits, or a quadratic fit unambiguously gives a non-zero coefficient for the quadratic term) then you can also see analytically how the gradient of the line is changing with time and when the peak was. As if you couldn't see it just by looking.

As you go to higher and higher orders of fit, bear in mind that the polynomials are a complete set so you could describe literally any function with them.

The usual physical model of an epidemic is the SIR, but that peaks when infection has reached a substantial fraction of the whole population, and that's not what's happening here. Also, you'd need to model that people are exposed before they become infectious, and that known infected people are quarantined, but there are lots of unknown infectious people. James Annan's model tries to take into account the fraction of infections which are actually detected, for example. But then - what? You'd be able to predict a little bit into the future assuming the lockdown rules aren't changed and/or people don't change their behaviour.
Yes. Pre-retirement I modelled microbial growth, survival, and death as affected by conditions, which models were intended (and used :o ) for prediction. Some people regarded such models as based on knowledge of mechanisms, I never quite believed that - in fact models were chosen as having approximately the right form and retrospectively justified. But that's by the way. With respect to Covid, as I said upthread:
I should emphasise more often and more clearly that I'm not using the regressions to draw inferences, and I'd include as inferences interpreting p values or doing significance tests or making predictions. I'm using the regressions simply as descriptive statistics - the data can be (approximately) described as "a curve of <this> form with weekday dependent offsets of <this>".
<snip>
I really wouldn't want to model the process, and I would take a lot of convincing that a single model was applicable for an extended period.

User avatar
sTeamTraen
After Pie
Posts: 2558
Joined: Mon Nov 11, 2019 4:24 pm
Location: Palma de Mallorca, Spain

Re: COVID-19

Post by sTeamTraen » Thu Dec 17, 2020 6:33 pm

The discussion in the last few posts reminds me a bit of trying to predict the stock market, in a world where everyone else is also trying to predict the stock market. I suspect that once you have (a) time on the X-axis and (b) human beings (with their ability to react in a conscious and, indeed, non-first-order way to the situation that they are in) as the subjects, all of our models are not only wrong, but intrinsically wrong.

Individuals and governments react, to varying degrees, to the intercept, the slope, and the slope of the slope, of the COVID-19 cases and deaths charts. That is, there is no "natural" process here (unless you want to try and model the political and social reactions as part of the process), and we cannot (I suspect) use any models for prediction --- only to describe, after the fact.

For a short while back in April-May I used to try and work out what the pandemic was doing, but I soon gave up on that. Now I find myself reading the daily numbers, not to work out what it means for the people who are infected or dying, but for what it will mean for how decisionmakers and the public react to those numbers. This feels uncomfortable, because the numbers represent large amounts of human suffering, but it's less uncomfortable than imagining that there is some kind of independent meaning to the numbers.
Something something hammer something something nail

User avatar
shpalman
Princess POW
Posts: 8266
Joined: Mon Nov 11, 2019 12:53 pm
Location: One step beyond
Contact:

Re: COVID-19

Post by shpalman » Thu Dec 17, 2020 6:41 pm

KAJ wrote:
Thu Dec 17, 2020 3:38 pm
Yes. Pre-retirement I modelled microbial growth, survival, and death as affected by conditions, which models were intended (and used :o ) for prediction. Some people regarded such models as based on knowledge of mechanisms, I never quite believed that - in fact models were chosen as having approximately the right form and retrospectively justified. But that's by the way. With respect to Covid, as I said upthread:
I should emphasise more often and more clearly that I'm not using the regressions to draw inferences, and I'd include as inferences interpreting p values or doing significance tests or making predictions. I'm using the regressions simply as descriptive statistics - the data can be (approximately) described as "a curve of <this> form with weekday dependent offsets of <this>".
<snip>
I really wouldn't want to model the process, and I would take a lot of convincing that a single model was applicable for an extended period.
Well, that would be a "phenomenological" model I suppose. You're only describing what's going on without any attempt to gain insight.

But if you're
looking for a (relatively) simple and interpretable description of the data.
then you do want some sort of meaningful interpretation, and if you want to go beyond "numbers are going up" vs. "numbers are going down" then you need a model informed by a theory such that the parameters in it have some physical meaning and you can say something according to the values of them which successfully describe the data.
having that swing is a necessary but not sufficient condition for it meaning a thing
@shpalman@mastodon.me.uk

KAJ
Fuzzable
Posts: 310
Joined: Thu Nov 14, 2019 5:05 pm
Location: UK

Re: COVID-19

Post by KAJ » Thu Dec 17, 2020 8:02 pm

shpalman wrote:
Thu Dec 17, 2020 6:41 pm
Well, that would be a "phenomenological" model I suppose. You're only describing what's going on without any attempt to gain insight.

But if you're
looking for a (relatively) simple and interpretable description of the data.
then you do want some sort of meaningful interpretation, and if you want to go beyond "numbers are going up" vs. "numbers are going down" then you need a model informed by a theory such that the parameters in it have some physical meaning and you can say something according to the values of them which successfully describe the data.
I don't want to go much beyond "numbers are going up" vs. "numbers are going down" because I explicitly don't want to get into "a model informed by a theory such that the parameters in it have some physical meaning" and I'm definitely not qualified to "say something according to the values of them". As jimbob said, I'd "end up trying to reinvent the whole field of epidemiology". I'm just trying to get a view of what the data is saying about changes, especially recent changes.

After the recent conversations I've decided (for now!) to use loess for the lomg term, to give an overall view...
loess.png
loess.png (36.18 KiB) Viewed 3432 times
... and context for shortish periods of interest where I'll use polynomials - no more than quadratic.
poly.png
poly.png (13.42 KiB) Viewed 3432 times
The R-sq of the latter (99%) satisfies me that this "phenomenological" model is a pretty accurate description of that period. It suggests (to me) that:
  1. the scatter around the trend line is largely attributable to systematic variation between days of the week
  2. the end of the lockdown followed the end of the decline in numbers, maybe even the start of the increase.

User avatar
lpm
Junior Mod
Posts: 5959
Joined: Mon Nov 11, 2019 1:05 pm

Re: COVID-19

Post by lpm » Thu Dec 17, 2020 8:39 pm

Don't forget, the little differences in your model will be tiny compared to the 11,000 cases lost on a spreadsheet in Wales. Inaccurate input is the real problem.
⭐ Awarded gold star 4 November 2021

KAJ
Fuzzable
Posts: 310
Joined: Thu Nov 14, 2019 5:05 pm
Location: UK

Re: COVID-19

Post by KAJ » Thu Dec 17, 2020 9:48 pm

lpm wrote:
Thu Dec 17, 2020 8:39 pm
Don't forget, the little differences in your model will be tiny compared to the 11,000 cases lost on a spreadsheet in Wales. Inaccurate input is the real problem.
I'm using cases by specimen date, not by report date. The chart below suggests that the numbers for a given specimen date usually (!) stabilise within about 5 days of the specimen date. The 5 most recent specimen dates are marked as "incomplete" by .gov.uk, I have zero weighted them in the regression and marked them on the regression charts.
00000b.png
00000b.png (57.03 KiB) Viewed 3390 times

User avatar
Bird on a Fire
Princess POW
Posts: 10137
Joined: Fri Oct 11, 2019 5:05 pm
Location: Portugal

Re: COVID-19

Post by Bird on a Fire » Thu Dec 17, 2020 10:13 pm

This thread must feel like a particularly annoying round of peer review for KAJ ;)
We have the right to a clean, healthy, sustainable environment.

User avatar
sTeamTraen
After Pie
Posts: 2558
Joined: Mon Nov 11, 2019 4:24 pm
Location: Palma de Mallorca, Spain

Re: COVID-19

Post by sTeamTraen » Fri Dec 18, 2020 12:12 am

Bird on a Fire wrote:
Thu Dec 17, 2020 10:13 pm
This thread must feel like a particularly annoying round of peer review for KAJ ;)
I've done two reviews for journals this week. It makes you think a bit weirdly. A friend and colleague had a piece in the New Statesman this week and I nearly sent him my thoughts in review form ("I think you should have emphasised X rather than Y"), rather than just "nice piece", which was what I said in the end.

Someone came up with an acronym, HIBAR ("Had I Been A Reviewer") for post-publication commentary in "principled peer-type review" format, which I quite like.
Something something hammer something something nail

KAJ
Fuzzable
Posts: 310
Joined: Thu Nov 14, 2019 5:05 pm
Location: UK

Re: COVID-19

Post by KAJ » Fri Dec 18, 2020 8:58 am

sTeamTraen wrote:
Fri Dec 18, 2020 12:12 am
Bird on a Fire wrote:
Thu Dec 17, 2020 10:13 pm
This thread must feel like a particularly annoying round of peer review for KAJ ;)
I've done two reviews for journals this week. It makes you think a bit weirdly. A friend and colleague had a piece in the New Statesman this week and I nearly sent him my thoughts in review form ("I think you should have emphasised X rather than Y"), rather than just "nice piece", which was what I said in the end.

Someone came up with an acronym, HIBAR ("Had I Been A Reviewer") for post-publication commentary in "principled peer-type review" format, which I quite like.
It does feel a bit like peer review, but not at all annoying. That's really why I've been posting in this thread, to improve my processes.

I quite like reasoned criticism of my work, I either learn or end up shown correct, boosting my (already large) ego. Professionally I learned (but still don't understand) that many others take criticism of their work personally. I learned to take that into account with my colleagues - and when doing peer review*. I'm told that my consequent abrupt changes of tack during discussion can be off-putting. I try to take that into account too, but less successfully.

So thanks to everyone for their comments.

* Two reviews in a week :o . My masters would have told me off for that! Each review took me several working days and hit my fee-earning time.

User avatar
shpalman
Princess POW
Posts: 8266
Joined: Mon Nov 11, 2019 12:53 pm
Location: One step beyond
Contact:

Re: COVID-19

Post by shpalman » Fri Dec 18, 2020 12:05 pm

KAJ wrote:
Thu Dec 17, 2020 8:02 pm
... and context for shortish periods of interest where I'll use polynomials - no more than quadratic.
Image
The R-sq of the latter (99%) satisfies me that this "phenomenological" model is a pretty accurate description of that period. It suggests (to me) that:
  1. the scatter around the trend line is largely attributable to systematic variation between days of the week
  2. the end of the lockdown followed the end of the decline in numbers, maybe even the start of the increase.
You can see the latter anyway with a seven-day (either side) average:
data_2020-Dec-17.png
data_2020-Dec-17.png (23.02 KiB) Viewed 3278 times
(which probably counts as a zeroth-order loess with a very simple weighting function)

You did a second-order fit, but the value of the coefficient of (day)^2 doesn't tell you anything apart from the fact that it's positive, which you can already see by looking.

It took me until the 6th of December before I noticed cases were going up again, but I noticed it just by looking at the data.
shpalman wrote:
Sun Dec 06, 2020 4:27 pm
Meanwhile I think the UK's cases per day have started going up again.
having that swing is a necessary but not sufficient condition for it meaning a thing
@shpalman@mastodon.me.uk

KAJ
Fuzzable
Posts: 310
Joined: Thu Nov 14, 2019 5:05 pm
Location: UK

Re: COVID-19

Post by KAJ » Fri Dec 18, 2020 12:59 pm

shpalman wrote:
Fri Dec 18, 2020 12:05 pm
KAJ wrote:
Thu Dec 17, 2020 8:02 pm
... and context for shortish periods of interest where I'll use polynomials - no more than quadratic.
Image
The R-sq of the latter (99%) satisfies me that this "phenomenological" model is a pretty accurate description of that period. It suggests (to me) that:
  1. the scatter around the trend line is largely attributable to systematic variation between days of the week
  2. the end of the lockdown followed the end of the decline in numbers, maybe even the start of the increase.
You can see the latter anyway with a seven-day (either side) average:

data_2020-Dec-17.png

(which probably counts as a zeroth-order loess with a very simple weighting function)

You did a second-order fit, but the value of the coefficient of (day)^2 doesn't tell you anything apart from the fact that it's positive, which you can already see by looking.

It took me until the 6th of December before I noticed cases were going up again, but I noticed it just by looking at the data.
shpalman wrote:
Sun Dec 06, 2020 4:27 pm
Meanwhile I think the UK's cases per day have started going up again.
De gustibus non est disputandum

User avatar
shpalman
Princess POW
Posts: 8266
Joined: Mon Nov 11, 2019 12:53 pm
Location: One step beyond
Contact:

Re: COVID-19

Post by shpalman » Fri Dec 18, 2020 3:07 pm

To be fair, SAGE has only just figured out that the reproduction number, or R value, of coronavirus transmission across the UK is now above 1 after only three weeks of the numbers obviously going up.
Last week, the R number was between 0.9 and 1.
Curious about how they figured that.
having that swing is a necessary but not sufficient condition for it meaning a thing
@shpalman@mastodon.me.uk

User avatar
jimbob
Light of Blast
Posts: 5296
Joined: Mon Nov 11, 2019 4:04 pm
Location: High Peak/Manchester

Re: COVID-19

Post by jimbob » Fri Dec 18, 2020 4:04 pm

shpalman wrote:
Fri Dec 18, 2020 3:07 pm
To be fair, SAGE has only just figured out that the reproduction number, or R value, of coronavirus transmission across the UK is now above 1 after only three weeks of the numbers obviously going up.
Last week, the R number was between 0.9 and 1.
Curious about how they figured that.
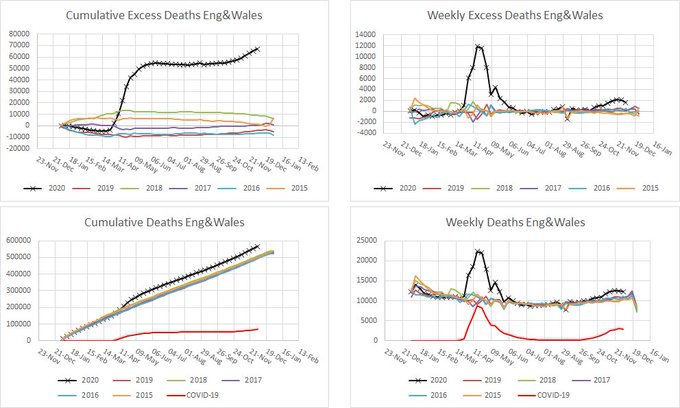
Exactly - all you need to do is to see if numbers are rising or falling. Further to your previous point. If we assume we're nowhere near herd immunity or any saturation, then exponential growth or decline should be a sufficient model. So a change in gradient in the log plot shows a change in some of the underlying factors affecting transmission.

This is what my England and Wales ONS data looks like now. Not pretty:

Image
Have you considered stupidity as an explanation

KAJ
Fuzzable
Posts: 310
Joined: Thu Nov 14, 2019 5:05 pm
Location: UK

Re: COVID-19

Post by KAJ » Fri Dec 18, 2020 4:12 pm

shpalman wrote:
Fri Dec 18, 2020 3:07 pm
To be fair, SAGE has only just figured out that the reproduction number, or R value, of coronavirus transmission across the UK is now above 1 after only three weeks of the numbers obviously going up.
Last week, the R number was between 0.9 and 1.
Curious about how they figured that.
You'll find some information at The R number and growth rate in the UK from which:
<snip>
Neither one measure, R nor growth rate, is better than the other but each provide information that is useful in monitoring the spread of a disease.

Estimates of the growth rates and R are currently updated on a weekly basis.
<snip>
Individual modelling groups use a range of data to estimate growth rates and R values, including:
<snip>
The growth rate and R are estimated by several independent modelling groups based in universities and Public Health England (PHE). The modelling groups discuss their individual R estimates at the Science Pandemic Influenza Modelling group (SPI-M) - a subgroup of SAGE.

User avatar
Gfamily
Light of Blast
Posts: 5212
Joined: Mon Nov 11, 2019 1:00 pm
Location: NW England

Re: COVID-19

Post by Gfamily » Fri Dec 18, 2020 4:52 pm

My sister (a GP in South Wales) reports that by the end of October their practice had a total of 45 positive tests (granted that many suspected cases hadn't been tested).
In November alone they had another 70 positive cases.
And 125 in the 2 ½ weeks of December so far.
My avatar was a scientific result that was later found to be 'mistaken' - I rarely claim to be 100% correct
ETA 5/8/20: I've been advised that the result was correct, it was the initial interpretation that needed to be withdrawn
Meta? I'd say so!

User avatar
jimbob
Light of Blast
Posts: 5296
Joined: Mon Nov 11, 2019 4:04 pm
Location: High Peak/Manchester

Re: COVID-19

Post by jimbob » Fri Dec 18, 2020 5:02 pm

Gfamily wrote:
Fri Dec 18, 2020 4:52 pm
My sister (a GP in South Wales) reports that by the end of October their practice had a total of 45 positive tests (granted that many suspected cases hadn't been tested).
In November alone they had another 70 positive cases.
And 125 in the 2 ½ weeks of December so far.
What LPM said about there being no fundamental difference between places with similar demographics wherever they are in the country except timing seems pretty accurate.
Have you considered stupidity as an explanation

User avatar
sTeamTraen
After Pie
Posts: 2558
Joined: Mon Nov 11, 2019 4:24 pm
Location: Palma de Mallorca, Spain

Re: COVID-19

Post by sTeamTraen » Fri Dec 18, 2020 8:21 pm

jimbob wrote:
Fri Dec 18, 2020 4:04 pm
shpalman wrote:
Fri Dec 18, 2020 3:07 pm
To be fair, SAGE has only just figured out that the reproduction number, or R value, of coronavirus transmission across the UK is now above 1 after only three weeks of the numbers obviously going up.
Last week, the R number was between 0.9 and 1.
Curious about how they figured that.
Exactly - all you need to do is to see if numbers are rising or falling.
Is that strictly true, though? Given that the definition of R (as opposed to, say, the doubling time) is independent of how long it takes each person to infect the 0.9 or 1.1 or 3.0 others that they end up infecting, it seems to me that you could have cases going up with an R number below 1, if the period during which people remain infectious has the right length. Hence why it seems to me that R is a sh.t measure of how a pandemic is going, even if R0 could be a useful measure for comparing pathogens at a virological level. It's hard to calculate and involves many more assumptions than doubling time.
Something something hammer something something nail

User avatar
sTeamTraen
After Pie
Posts: 2558
Joined: Mon Nov 11, 2019 4:24 pm
Location: Palma de Mallorca, Spain

Re: COVID-19

Post by sTeamTraen » Fri Dec 18, 2020 8:24 pm

KAJ wrote:
Fri Dec 18, 2020 8:58 am
* Two reviews in a week :o . My masters would have told me off for that! Each review took me several working days and hit my fee-earning time.
The first was "Why the hell wasn't this desk-rejected?" and the second isn't finished yet, so "I've done" was not strictly accurate. But I'm currently learning Spanish and getting confused by exactly what all 17 flavours of past tense mean anyway. :D
Something something hammer something something nail

Millennie Al
After Pie
Posts: 1621
Joined: Mon Mar 16, 2020 4:02 am

Re: COVID-19

Post by Millennie Al » Sat Dec 19, 2020 4:50 am

sTeamTraen wrote:
Thu Dec 17, 2020 6:33 pm
The discussion in the last few posts reminds me a bit of trying to predict the stock market, in a world where everyone else is also trying to predict the stock market. I suspect that once you have (a) time on the X-axis and (b) human beings (with their ability to react in a conscious and, indeed, non-first-order way to the situation that they are in) as the subjects, all of our models are not only wrong, but intrinsically wrong.
Yes, with one exception (which is probably exceedingly rare). That is when there is a fixed point in the model. Assuming you have factors A, B, C,... W which are relevant to making a prediction, and the predicted value is X, then you must have:

X = model(A, B, C, ..., W, X)

If we create a model, aebe (all else being equal) which takes only X as a parameter because the known values of A..W are built in, we have

X = aebe(X)

Each solution to that is stable, and values which are not solutions to that cannot be validly predicted because the act of predicting that value changes what will happen.

So if we are modelling the share price of ACME when trading opens, we might find X=0 is stable, and X=32, but no other values because X >32 causes a runaway bubble, while 0 < X < 32 causes a runaway sell-off.

Of course, there's another path to successful modelling, which is where you keep the results of the model secret and ensure that acting on them is never so significant to break the model. It is suspected that this is what Renaissance Technologies does with its Medallion Fund. But I don't see how that would apply to epidemiology.

User avatar
shpalman
Princess POW
Posts: 8266
Joined: Mon Nov 11, 2019 12:53 pm
Location: One step beyond
Contact:

Re: COVID-19

Post by shpalman » Sat Dec 19, 2020 7:36 am

sTeamTraen wrote:
Fri Dec 18, 2020 8:21 pm
jimbob wrote:
Fri Dec 18, 2020 4:04 pm
shpalman wrote:
Fri Dec 18, 2020 3:07 pm
To be fair, SAGE has only just figured out that the reproduction number, or R value, of coronavirus transmission across the UK is now above 1 after only three weeks of the numbers obviously going up.


Curious about how they figured that.
Exactly - all you need to do is to see if numbers are rising or falling.
Is that strictly true, though? Given that the definition of R (as opposed to, say, the doubling time) is independent of how long it takes each person to infect the 0.9 or 1.1 or 3.0 others that they end up infecting, it seems to me that you could have cases going up with an R number below 1, if the period during which people remain infectious has the right length. Hence why it seems to me that R is a sh.t measure of how a pandemic is going, even if R0 could be a useful measure for comparing pathogens at a virological level. It's hard to calculate and involves many more assumptions than doubling time.
R would be the number of people each person (on average) infects for the whole period in which they remain infectious.

You can have cases going down with R0>1 as you start to run out of susceptible population (i.e. Rt<1) but I don't really see how you could have cases going up with R0<1.

"Cases going up" means a general increase in numbers of people newly infected from one day to another, not an increase in total number of people infected (which depends also on the rate at which people recover).

Willing to see a model or a calculation which demonstrates the contrary.
having that swing is a necessary but not sufficient condition for it meaning a thing
@shpalman@mastodon.me.uk

User avatar
shpalman
Princess POW
Posts: 8266
Joined: Mon Nov 11, 2019 12:53 pm
Location: One step beyond
Contact:

Re: COVID-19

Post by shpalman » Sat Dec 19, 2020 7:47 am

sTeamTraen wrote:
Thu Dec 17, 2020 6:33 pm
The discussion in the last few posts reminds me a bit of trying to predict the stock market, in a world where everyone else is also trying to predict the stock market. I suspect that once you have (a) time on the X-axis and (b) human beings (with their ability to react in a conscious and, indeed, non-first-order way to the situation that they are in) as the subjects, all of our models are not only wrong, but intrinsically wrong.
Well, nobody has a model which could predict the exact number of new positive results which will come in this evening (or how many cases there will eventually have been for the 19th of December once they've all been reported in 4-5 days from now).

People saying "look it gets better on its own we haz teh heard immuniteh" aren't taking into account that people realise it's getting bad and start to take measures even if they aren't enforced; people who say "the measures aren't working it's still going up" probably aren't taking into account that people aren't following the measures.

But at the same the models aren't completely useless, it's not completely random, and it is possible to take measures and see their effects, and there's the whole of SPI-B devoted to people's behaviour. What doesn't work is when the epidemiologists already decide that there's no point modelling because you can't enforce measures anyway "because people".
pyle-weather.jpg
pyle-weather.jpg (107.74 KiB) Viewed 3090 times
having that swing is a necessary but not sufficient condition for it meaning a thing
@shpalman@mastodon.me.uk

User avatar
sTeamTraen
After Pie
Posts: 2558
Joined: Mon Nov 11, 2019 4:24 pm
Location: Palma de Mallorca, Spain

Re: COVID-19

Post by sTeamTraen » Sat Dec 19, 2020 12:36 pm

shpalman wrote:
Sat Dec 19, 2020 7:36 am
You can have cases going down with R0>1 as you start to run out of susceptible population (i.e. Rt<1) but I don't really see how you could have cases going up with R0<1.
I think (but this is entirely in my head, where it shares space with quite a variety of neighbours) that you could get this over a short period of time if the infections were front-loaded. Say you have 100 infected people, they are ultimately destined to infect 0.9 others each, and they remain infectious for 10 days, but 80 of them infect their partner when they go home that evening. So you would go from 100 to 180. Of course, it depends on assumptions, and over a (quite small) number of multiples of the infectiousness period this will all even out, so it's not something you would need to worry about in a large population.

I freely grant that this is also possibly total bollocks that will fall apart with the application of proper mathematics.
Something something hammer something something nail

User avatar
shpalman
Princess POW
Posts: 8266
Joined: Mon Nov 11, 2019 12:53 pm
Location: One step beyond
Contact:

Re: COVID-19

Post by shpalman » Sat Dec 19, 2020 12:46 pm

sTeamTraen wrote:
Sat Dec 19, 2020 12:36 pm
shpalman wrote:
Sat Dec 19, 2020 7:36 am
You can have cases going down with R0>1 as you start to run out of susceptible population (i.e. Rt<1) but I don't really see how you could have cases going up with R0<1.
I think (but this is entirely in my head, where it shares space with quite a variety of neighbours) that you could get this over a short period of time if the infections were front-loaded. Say you have 100 infected people, they are ultimately destined to infect 0.9 others each, and they remain infectious for 10 days, but 80 of them infect their partner when they go home that evening. So you would go from 100 to 180. Of course, it depends on assumptions, and over a (quite small) number of multiples of the infectiousness period this will all even out, so it's not something you would need to worry about in a large population.

I freely grant that this is also possibly total bollocks that will fall apart with the application of proper mathematics.
In that case, you had 100 infections which had presumably been registered one day, and then 80 infections which you'll register the next day.

Or you'll go from 0 one day to all 180 the next but that's an issue with lag in the reporting of the first 100. But this is why we do the 7-day averaging and wait a few days for most of the cases to be reported.
having that swing is a necessary but not sufficient condition for it meaning a thing
@shpalman@mastodon.me.uk

Locked