Page 202 of 258
Re: COVID-19
Posted: Fri Jan 15, 2021 2:14 pm
by Woodchopper
lpm wrote: ↑Fri Jan 15, 2021 2:04 pm
My God, nearly a year on and Sage is still f.cking up their models. How can they possibly be this bad? Are they locked in a dark room only able to see their models and none of the other data?
We can all see that cases have basically peaked, with the start of the decline beginning in some places. Nowhere are cases still shooting up. R is clearly at around 0.8 or 0.9 or maybe 1.0 or perhaps 1.1 in some places.
What it obviously cannot be is 1.2 to 1.3.
Can anyone explain why these modellers are so bad?
The reproduction number, or R value, of coronavirus transmission in the UK is between 1.2 and 1.3, the Government Office for Science and the Scientific Advisory Group for Emergencies (Sage) has said.
Are they using other data than the case numbers? I agree that they seem to have levelled off. But then again we know that numbers of infected are much larger than the number of positive tests.
For example there appears to still be an upward trend in hospital admissions.
Re: COVID-19
Posted: Fri Jan 15, 2021 2:25 pm
by Bird on a Fire
R isn't the same as growth rate, and there may be significant regional variation making a UK-wide statistic misleading.
As for the data they use, there are reasons to expect their estimate of R to lag behind the present by a few weeks:
How R and growth rates are estimated
Individual modelling groups use a range of data to estimate growth rates and R values, including:
epidemiological data such as testing data, hospital admissions, ICU admissions and deaths – it generally takes up to 3 weeks for changes in the spread of the disease to be reflected in the estimates due to the time delay between initial infection and the need for hospital care
contact pattern surveys that gather information on behaviour – these can be quicker (with a lag of around a week) but can be open to bias as they often rely on self-reported behaviour and make assumptions about how the information collected relates to the spread of disease
household infection surveys where swabs are performed on individuals – these can provide estimates of how many people are infected. Longitudinal surveys (where samples are repeatedly taken from the same people) allow a more direct estimate of the growth in infection rates
Different modelling groups use different data sources to estimate these values using mathematical models that simulate the spread of infections. Some may even use all these sources of information to adjust their models to better reflect the real-world situation. There is uncertainty in all these data sources so estimates can vary between different models, so we do not rely on just one model. Evidence from several models is considered, discussed, combined, and the growth rate and R are then presented as ranges. The most likely true values are somewhere within the ranges.
Rounding and differences between the data streams used in these individual model outputs that are combined account for differences between estimates of R and estimated growth rates.
Who estimates the R and growth rates
The growth rate and R are estimated by several independent modelling groups based in universities and Public Health England (PHE). The modelling groups discuss their individual R estimates at the Science Pandemic Influenza Modelling group (SPI-M) - a subgroup of SAGE.
Time delay of the estimates
SPI-M use several models, each using data from a variety of sources in their estimates of R and growth rate. Epidemiological data, such as hospital admissions, ICU admissions and deaths, usually takes up to 3 weeks to reflect changes in the spread of disease.
This is due to the time delay between initial infection, having symptoms and the need for hospital care. As a result, the latest published figures represent the situation over the past few weeks rather than today. These estimates do not yet fully reflect any very recent changes in transmission due to, for example, recent policy changes in the UK.
Limitations of R
R is an average value that can vary in different parts of the country, communities, and subsections of the population. It cannot be measured directly so there is always uncertainty around its exact value. This becomes even more of a problem when calculating R using small numbers of cases, either due to lower infection rates or smaller geographical areas. This uncertainty may be due to variability in the underlying data, leading to a wider range for R and more frequent changes in the estimates.
Even when the overall UK R estimate is below 1, some regions may have R estimates that include ranges that exceed 1, for example from 0.7 to 1.1; this does not necessarily mean the epidemic is increasing in that region, just that the uncertainty means it cannot be ruled out. It is also possible that an outbreak in one specific place could result in an R above 1 for the whole region.
From
https://www.gov.uk/guidance/the-r-number-in-the-uk
Re: COVID-19
Posted: Fri Jan 15, 2021 2:45 pm
by lpm
All that says is simply that these estimates should not under any circumstances be issued and publicised. They are just part of internal models and are horribly misleading when used outside.
What's the point in announcing this crap when it's based on old data? Three weeks is a hell of a time - that's from when we were having our Christmas pudding.
Take a note of how everyone will report this. They will use the present tense. They will not say "The R number
was". They will say
is. For example, here's the BBC:
UK's R number is between 1.2 and 1.3
The reproduction number, or R value, of coronavirus transmission in the UK is between 1.2 and 1.3, the Government Office for Science and the Scientific Advisory Group for Emergencies (Sage) has said.
Last week, it was between 1 and 1.4.
The R number represents the average number of people each Covid-19 positive person goes on to infect.
When the figure is above one, it means the coronavirus epidemic is growing.
Also most of their caveats only apply at low infection levels when "noise" in the stats between communities or timeframes makes an impact. At the current ultra-high infection rates, the overwhelming signal swamps the noise - even at small geographical zones. One meat packing plant might distort the numbers in the summer but will hardly be a blip today.
They're a bunch of f.cking idiots.
Re: COVID-19
Posted: Fri Jan 15, 2021 2:47 pm
by KAJ
Deleted (should have read the thread before posting)
Re: COVID-19
Posted: Fri Jan 15, 2021 5:17 pm
by headshot
James Annan has something to say about R.
Re: COVID-19
Posted: Fri Jan 15, 2021 6:54 pm
by jimbob
Meanwhile.
Sweden.
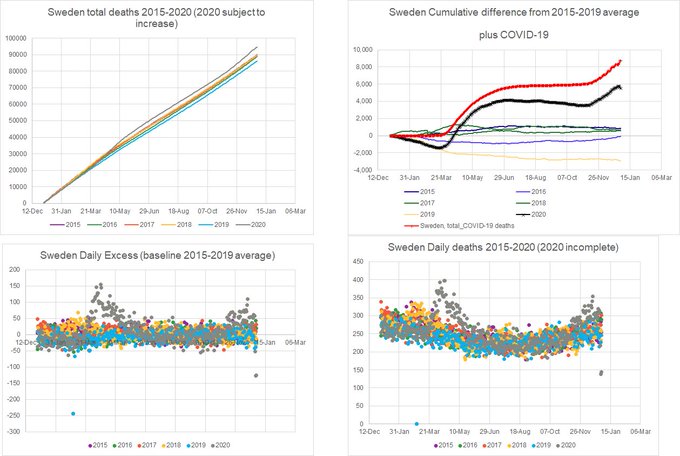
I've downloaded the data from Sweden's statistics bureau, and using their 2015-2019 average as a baseline, have calculated the cumulative excess deaths for 2015-2020
https://www.scb.se/en/finding-statistic ... tatistics/
Preliminary statistics on deaths (published 2021-01-11)
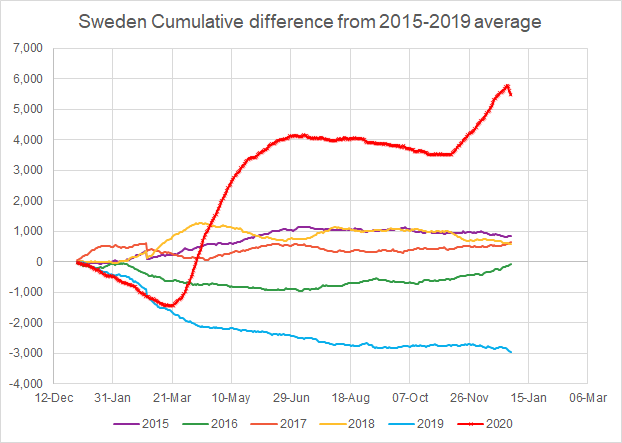
remember that due to the reporting lag, those last few days in December will rise in future
Re: COVID-19
Posted: Fri Jan 15, 2021 7:25 pm
by shpalman
This what Lombardy looks like with its R so high it will go from Orange to Red next week.
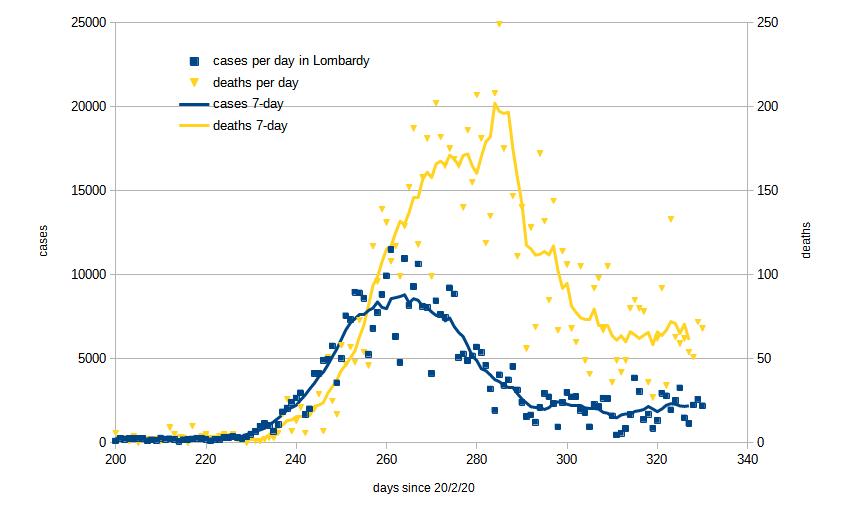
- Lombardy-20210115.jpg (35.03 KiB) Viewed 2808 times
Currently at about 150 new cases per 100,000 per day.
School kids are protesting about having to go back to distance learning when term finally starts; apparently "six hours a day in front of a computer screen" is difficult; well it's excellent preparation for most adult jobs.
Re: COVID-19
Posted: Fri Jan 15, 2021 8:27 pm
by Hunting Dog
shpalman wrote: ↑Fri Jan 15, 2021 7:25 pm
School kids are protesting about having to go back to distance learning when term finally starts; apparently
"six hours a day in front of a computer screen" is difficult; well it's excellent preparation for most adult jobs.
So these obviously aren't the kids that normally spend all non-school time in front of screens for social media or games?
Re: COVID-19
Posted: Fri Jan 15, 2021 9:10 pm
by Fishnut
Hunting Dog wrote: ↑Fri Jan 15, 2021 8:27 pm
shpalman wrote: ↑Fri Jan 15, 2021 7:25 pm
School kids are protesting about having to go back to distance learning when term finally starts; apparently
"six hours a day in front of a computer screen" is difficult; well it's excellent preparation for most adult jobs.
So these obviously aren't the kids that normally spend all non-school time in front of screens for social media or games?
I can't speak for anyone else but I know I found it was quite an adjustment to get used to online learning. Watching lectures online is different to watching them in person, and I get the impression that a lot of the stuff they're being asked to do isn't being particularly guided but more "here's a load of work to do, email if you've got any problem". Undergrads have difficulty adapting to this, so I'm not at all surprised young kids do. Online learning a very different experience to classroom learning and I'm not sure that mocking kids for struggling to adapt when they, their teachers and their parents are being constantly messed around is really the best approach.
Re: COVID-19
Posted: Sat Jan 16, 2021 11:13 am
by shpalman
shpalman wrote: ↑Fri Jan 15, 2021 7:25 pm
This what Lombardy looks like with its R so high it will go from Orange to Red next week.

Currently at about 150 new cases per 100,000 per day.
Fontana is complaining that having to be a Red zone next week is an "unjust punishment" based on old numbers, which it might be, but it's true that cases are slowly trending upwards despite being an Orange zone so something a bit stronger is needed to make daily cases trend down again.
As I said it doesn't make much difference to me what colour we are because I can always do what I need to do and I still can't do what I want to do so I'd rather we locked down harder and got on with vaccinating people.
Re: COVID-19
Posted: Sat Jan 16, 2021 1:32 pm
by shpalman
So while Lombardy is complaining about being made a Red zone, Sicily actually asked to be a Red zone.
It doesn't really matter what you do, somebody is going to complain, so you might as well lock down harder.
Re: COVID-19
Posted: Sat Jan 16, 2021 5:38 pm
by jimbob
jimbob wrote: ↑Fri Jan 15, 2021 6:54 pm
Meanwhile.
Sweden.
I've downloaded the data from Sweden's statistics bureau, and using their 2015-2019 average as a baseline, have calculated the cumulative excess deaths for 2015-2020
https://www.scb.se/en/finding-statistic ... tatistics/
Preliminary statistics on deaths (published 2021-01-11)
remember that due to the reporting lag, those last few days in December will rise in future
Now with COVID-19 deaths from Our World in Data added for comparison
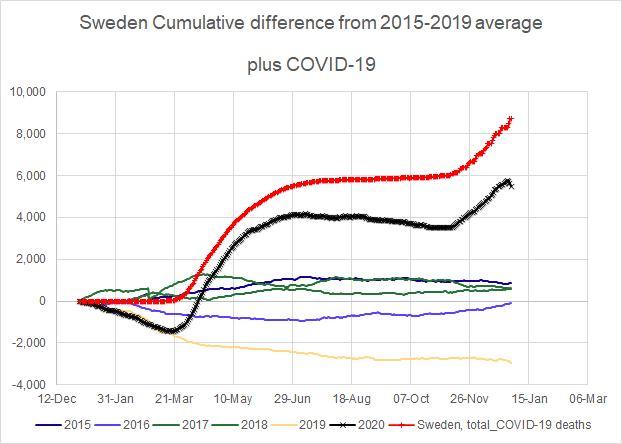
bUt ThEy'Re LoCkDoWn DeAtHs
Re: COVID-19
Posted: Sat Jan 16, 2021 5:42 pm
by shpalman
I've got no idea if a difference of 4000 deaths per whatever unit of time that is, is a lot or not much compared to their baseline death rate, because you removed that information from the plot.
ETA I mean this graph is right in the Excel file on the page you linked to
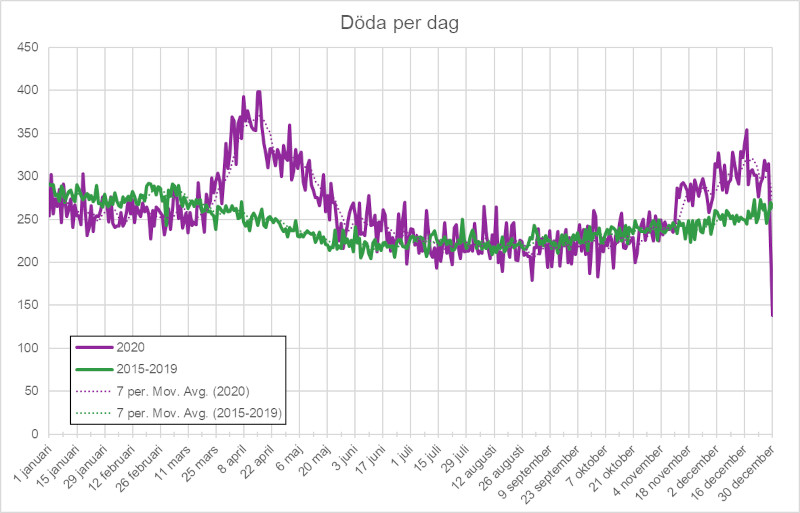
- dodaperdag.jpg (88.16 KiB) Viewed 2625 times
you can immediately see how the order of magnitude of the 2020 deaths compares to the baseline.
Re: COVID-19
Posted: Sat Jan 16, 2021 7:18 pm
by Woodchopper
ICNARC report on COVID-19 in crical care: England, Wales and Northern Ireland 15 January 2021
https://www.icnarc.org/DataServices/Att ... 505601089b
Re: COVID-19
Posted: Sat Jan 16, 2021 7:26 pm
by Woodchopper
Do antibody positive healthcare workers have lower SARS-CoV-2 infection rates than antibody negative healthcare workers? Large multi-centre prospective cohort study (the SIREN study), England: June to November 2020
“ A prior history of SARS-CoV-2 infection was associated with an 83% lower risk of infection, with median protective effect observed five months following primary infection.”
https://www.medrxiv.org/content/10.1101 ... 21249642v1
Re: COVID-19
Posted: Sat Jan 16, 2021 7:29 pm
by Woodchopper
lpm wrote: ↑Fri Jan 15, 2021 2:45 pm
All that says is simply that these estimates should not under any circumstances be issued and publicised. They are just part of internal models and are horribly misleading when used outside.
What's the point in announcing this crap when it's based on old data? Three weeks is a hell of a time - that's from when we were having our Christmas pudding.
Take a note of how everyone will report this. They will use the present tense. They will not say "The R number
was". They will say
is. For example, here's the BBC:
UK's R number is between 1.2 and 1.3
The reproduction number, or R value, of coronavirus transmission in the UK is between 1.2 and 1.3, the Government Office for Science and the Scientific Advisory Group for Emergencies (Sage) has said.
Last week, it was between 1 and 1.4.
The R number represents the average number of people each Covid-19 positive person goes on to infect.
When the figure is above one, it means the coronavirus epidemic is growing.
Also most of their caveats only apply at low infection levels when "noise" in the stats between communities or timeframes makes an impact. At the current ultra-high infection rates, the overwhelming signal swamps the noise - even at small geographical zones. One meat packing plant might distort the numbers in the summer but will hardly be a blip today.
They're a bunch of f.cking idiots.
Much more plausible R estimate to be found here:
https://www.mrc-bsu.cam.ac.uk/nowcastin ... uary-2021/
Re: COVID-19
Posted: Sat Jan 16, 2021 8:26 pm
by Woodchopper
Dismantling myths on the airborne transmission of severe acute respiratory syndrome coronavirus (SARS-CoV-2)
https://www.journalofhospitalinfection. ... 4/fulltext
Re: COVID-19
Posted: Sat Jan 16, 2021 8:49 pm
by Martin Y
Woodchopper wrote: ↑Sat Jan 16, 2021 7:26 pm
Do antibody positive healthcare workers have lower SARS-CoV-2 infection rates than antibody negative healthcare workers? Large multi-centre prospective cohort study (the SIREN study), England: June to November 2020
“ A prior history of SARS-CoV-2 infection was associated with an 83% lower risk of infection, with median protective effect observed five months following primary infection.”
https://www.medrxiv.org/content/10.1101 ... 21249642v1
Thanks for this. It's perfect ammo for a discussion elsewhere which just produced this:
"I don't understand why they are not using staff with confirmed Covid (current or previously infected) to staff Covid wards". Not only does it confirm that simply isn't true, it explains why it's no magic bullet.
OTOH, it's less good news than one might have hoped. If you had asked me to guess, I would have said previous infection might give hospital staff protection against being reinfected somewhere in the high 90s percent. 83% doesn't sound good. Maybe I'm unrealistic.
Re: COVID-19
Posted: Sat Jan 16, 2021 9:46 pm
by jimbob
shpalman wrote: ↑Sat Jan 16, 2021 5:42 pm
I've got no idea if a difference of 4000 deaths per whatever unit of time that is, is a lot or not much compared to their baseline death rate, because you removed that information from the plot.
ETA I mean this graph is right in the Excel file on the page you linked to
dodaperdag.jpg
you can immediately see how the order of magnitude of the 2020 deaths compares to the baseline.
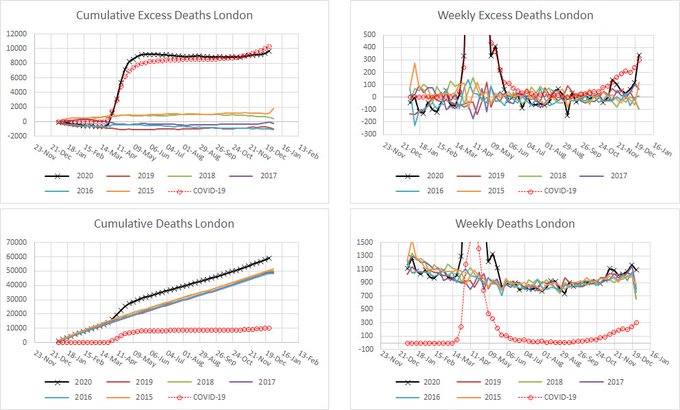
Well it showed that it was about twice the usual annual variation but here's my more usual dashboard type presentation.
With them presenting daily deaths, even by date of death, it's very noisy, because you expect different patterns during the week and weekend - especially for accidents.
Re: COVID-19
Posted: Sat Jan 16, 2021 9:46 pm
by Woodchopper
Martin Y wrote: ↑Sat Jan 16, 2021 8:49 pm
Woodchopper wrote: ↑Sat Jan 16, 2021 7:26 pm
Do antibody positive healthcare workers have lower SARS-CoV-2 infection rates than antibody negative healthcare workers? Large multi-centre prospective cohort study (the SIREN study), England: June to November 2020
“ A prior history of SARS-CoV-2 infection was associated with an 83% lower risk of infection, with median protective effect observed five months following primary infection.”
https://www.medrxiv.org/content/10.1101 ... 21249642v1
Thanks for this. It's perfect ammo for a discussion elsewhere which just produced this:
"I don't understand why they are not using staff with confirmed Covid (current or previously infected) to staff Covid wards". Not only does it confirm that simply isn't true, it explains why it's no magic bullet.
OTOH, it's less good news than one might have hoped. If you had asked me to guess, I would have said previous infection might give hospital staff protection against being reinfected somewhere in the high 90s percent. 83% doesn't sound good. Maybe I'm unrealistic.
It seems like people who have been reinfected get a mild case. But they will still probably be able to pass it on.
Re: COVID-19
Posted: Sat Jan 16, 2021 9:51 pm
by shpalman
Woodchopper wrote: ↑Sat Jan 16, 2021 9:46 pm
Martin Y wrote: ↑Sat Jan 16, 2021 8:49 pm
Woodchopper wrote: ↑Sat Jan 16, 2021 7:26 pm
Do antibody positive healthcare workers have lower SARS-CoV-2 infection rates than antibody negative healthcare workers? Large multi-centre prospective cohort study (the SIREN study), England: June to November 2020
“ A prior history of SARS-CoV-2 infection was associated with an 83% lower risk of infection, with median protective effect observed five months following primary infection.”
https://www.medrxiv.org/content/10.1101 ... 21249642v1
Thanks for this. It's perfect ammo for a discussion elsewhere which just produced this:
"I don't understand why they are not using staff with confirmed Covid (current or previously infected) to staff Covid wards". Not only does it confirm that simply isn't true, it explains why it's no magic bullet.
OTOH, it's less good news than one might have hoped. If you had asked me to guess, I would have said previous infection might give hospital staff protection against being reinfected somewhere in the high 90s percent. 83% doesn't sound good. Maybe I'm unrealistic.
It seems like people who have been reinfected get a mild case. But they will still probably be able to pass it on.
Similar to the vaccine then.
Re: COVID-19
Posted: Sat Jan 16, 2021 10:21 pm
by jimbob
jimbob wrote: ↑Sat Jan 16, 2021 9:46 pm
shpalman wrote: ↑Sat Jan 16, 2021 5:42 pm
I've got no idea if a difference of 4000 deaths per whatever unit of time that is, is a lot or not much compared to their baseline death rate, because you removed that information from the plot.
ETA I mean this graph is right in the Excel file on the page you linked to
dodaperdag.jpg
you can immediately see how the order of magnitude of the 2020 deaths compares to the baseline.
Well it showed that it was about twice the usual annual variation but here's my more usual dashboard type presentation.
With them presenting daily deaths, even by date of death, it's very noisy, because you expect different patterns during the week and weekend - especially for accidents.
London now:
Re: COVID-19
Posted: Sun Jan 17, 2021 1:17 am
by jimbob
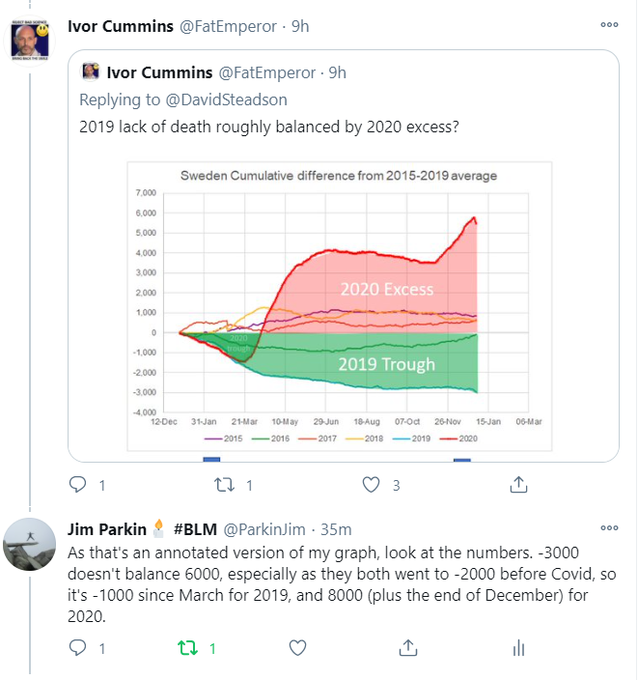
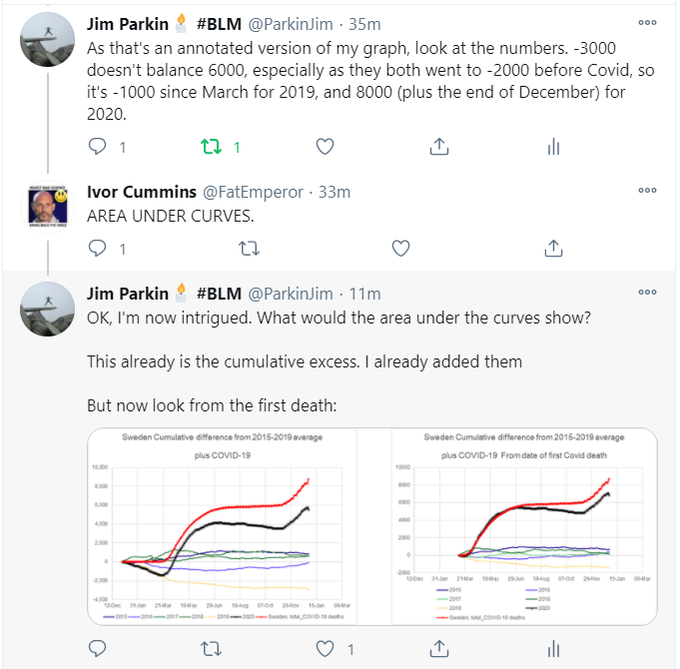
Ivor Cummins seems to like my graph. But he's even more of an innumerate idiot than I thought
https://twitter.com/FatEmperor/status/1 ... 75136?s=20
Re: COVID-19
Posted: Sun Jan 17, 2021 2:52 am
by Brightonian
Re: COVID-19
Posted: Sun Jan 17, 2021 7:25 am
by bob sterman
jimbob wrote: ↑Sun Jan 17, 2021 1:17 am
Ivor Cummins seems to like my graph. But he's even more of an innumerate idiot than I thought
Bet he understands cumulative income from his social media activities. Ask him.to plot that.
I bet his "excess income" for 2020 is way above his baseline.