having that swing is a necessary but not sufficient condition for it meaning a thing
@shpalman@mastodon.me.uk
@shpalman.bsky.social / bsky.app/profile/chrastina.net
threads.net/@dannychrastina
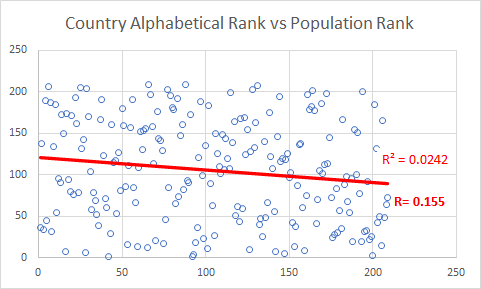
To be fair, a correlation of 0.06 is very often uninteresting even before graphing it. And as you increase the correlation it becomes a lot harder to draw pictures.
Something something hammer something something nail
sTeamTraen wrote: Wed Dec 29, 2021 10:48 pm
To be fair, a correlation of 0.06 is very often uninteresting even before graphing it. And as you increase the correlation it becomes a lot harder to draw pictures.
True, but there are plenty of more straightforward examples that do work
From the NIST/SEMATECH e-Handbook of Statistical Methods, http://www.itl.nist.gov/div898/handbook/ which I point new engineers to when they ask me questions about the background to stats that we use.
having that swing is a necessary but not sufficient condition for it meaning a thing
@shpalman@mastodon.me.uk
@shpalman.bsky.social / bsky.app/profile/chrastina.net
threads.net/@dannychrastina