Page 1 of 1
Always visualization your data
Posted: Tue Dec 28, 2021 3:12 pm
by shpalman
Re: Always visualization your data
Posted: Tue Dec 28, 2021 5:05 pm
by Allo V Psycho
Re: Always visualization your data
Posted: Wed Dec 29, 2021 10:48 pm
by sTeamTraen
To be fair, a correlation of 0.06 is very often uninteresting even before graphing it. And as you increase the correlation it becomes a lot harder to draw pictures.
Re: Always visualization your data
Posted: Thu Dec 30, 2021 11:33 am
by jimbob
sTeamTraen wrote: ↑Wed Dec 29, 2021 10:48 pm
To be fair, a correlation of 0.06 is very often uninteresting even before graphing it. And as you increase the correlation it becomes a lot harder to draw pictures.
True, but there are plenty of more straightforward examples that do work
From the NIST/SEMATECH e-Handbook of Statistical Methods,
http://www.itl.nist.gov/div898/handbook/ which I point new engineers to when they ask me questions about the background to stats that we use.
https://www.itl.nist.gov/div898/handboo ... /eda16.htm
- anscomb4.gif (7.46 KiB) Viewed 1878 times
Re: Always visualization your data
Posted: Thu Dec 30, 2021 11:34 am
by sTeamTraen
Results like data set 4 there appear a lot in psychology.
Re: Always visualization your data
Posted: Thu Dec 30, 2021 12:33 pm
by jimbob
sTeamTraen wrote: ↑Thu Dec 30, 2021 11:34 am
Results like data set 4 there appear a lot in psychology.
On brand for you, @sTeamTraen
Re: Always visualization your data
Posted: Thu Dec 30, 2021 12:44 pm
by shpalman
Re: Always visualization your data
Posted: Thu Dec 30, 2021 12:52 pm
by jimbob
Ha,
Don't forget this.
https://twitter.com/mdespriee/status/13 ... 69568?s=20
The person who posted the original graphs deleted his account. It was about phrenology and whether someone seemed trustworthy.
It did inspire me to go fishing and find a stronger correlation than some they were reporting
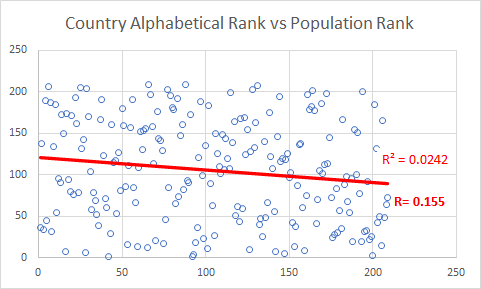
Yes, that is China is population rank=1 Afghanistan alphabetical rank=1 and yes it is bad.
Re: Always visualization your data
Posted: Fri Dec 31, 2021 9:35 pm
by Stupidosaurus
Raaagh! Raaagh! Raaaaaaaaagh!