Just been pwned on Twitter by a “people die get used to it” account who pointed out deaths over the last three weeks are lower than the five year average for deaths in the UK. Now that isn’t surprising when you consider two of those years are a pandemic but it also seems to apply for the five year average up to 2019. I find this a bit surprising- Am I I missing something or should I gracefully accept defeat?
Re: Five Year Death Average For UK
Posted: Wed Feb 02, 2022 10:45 pm
by shpalman
Without actually checking any facts or boring stuff like that, wot I reckon is that a lot of people who would have died this winter from the usual non-covid things people used to die of in winter, have already died with or because of covid.
And then the covid restrictions and changes in behaviour may also help against respiratory infections in general.
Just been pwned on Twitter by a “people die get used to it” account who pointed out deaths over the last three weeks are lower than the five year average for deaths in the UK. Now that isn’t surprising when you consider two of those years are a pandemic but it also seems to apply for the five year average up to 2019. I find this a bit surprising- Am I I missing something or should I gracefully accept defeat?
I'd expect that the figures for the most recent 3 weeks might not be complete - and if so, would be likely to increase rather than decrease.
Also, do they mean 'lower than the overall average 2014-19' or 'lower than the comparable 3 weeks of the year' ?
Also, of the 170,000 people who died earlier than expected over the last 2 years, a certain number of those would be ones that would have died this month.
So - ask them what they think their number means, and work on analysing their interpretation. Or don't bother.
Just been pwned on Twitter by a “people die get used to it” account who pointed out deaths over the last three weeks are lower than the five year average for deaths in the UK. Now that isn’t surprising when you consider two of those years are a pandemic but it also seems to apply for the five year average up to 2019. I find this a bit surprising- Am I I missing something or should I gracefully accept defeat?
I'd expect that the figures for the most recent 3 weeks might not be complete - and if so, would be likely to increase rather than decrease.
I guess they must be using the provisional figures in the latest weekly reports, the most recent of which did find that deaths were lower:
Mortality statistics in England and Wales are based on the details collected when deaths are certified and registered. Provisional figures, which have not been subject to the full quality assurance process, are published weekly and monthly.
Deaths registered weekly in England and Wales, provisional: week ending 21 January 2022. This is the latest release. Release date: 1 February 2022
In the week ending 21 January 2022 (Week 3), 12,776 deaths were registered in England and Wales; this was 535 fewer deaths than the previous week (Week 2) and 8.6% below the five-year average (1,203 fewer deaths).
The number of deaths registered in England in the week ending 21 January 2022 (Week 3) was 12,012; this was 387 fewer deaths than the previous week (Week 2) and 8.4% below the five-year average (1,099 fewer deaths).
The number of deaths registered in Wales in the week ending 21 January 2022 (Week 3) was 743; this was 141 fewer deaths than the previous week (Week 2) and 11.5% below the five-year average (97 fewer deaths).
Compared with the 2015 to 2019 five-year average (as opposed to the new five-year average used in the previous main points), deaths in England and Wales were 3.3% below average (440 fewer deaths); deaths were 2.9% below average in England (358 fewer deaths) and 8.5% below average in Wales (69 fewer deaths).
If the figures are for deaths registered 1-21 Jan and the release date is 1 Feb I wouldn't bank on the numbers increasing unless someone belatedly spots a mistake.
I reckon it's your 3rd suggestion and what shpalman said - a lot of people who would have died this winter from the usual non-covid things people used to die of in winter, have already died with or because of covid [From the week ending 13 March 2020 to the week ending 21 January 2022, the number of excess deaths above the five-year average in England and Wales was 125,627].
Re: Five Year Death Average For UK
Posted: Thu Feb 03, 2022 3:33 am
by Stranger Mouse
I suppose there’s not a lot of flu around at the moment as far as I can tell - the real test will be if the reduction in deaths continues outside of flu season
I suppose there’s not a lot of flu around at the moment as far as I can tell - the real test will be if the reduction in deaths continues outside of flu season
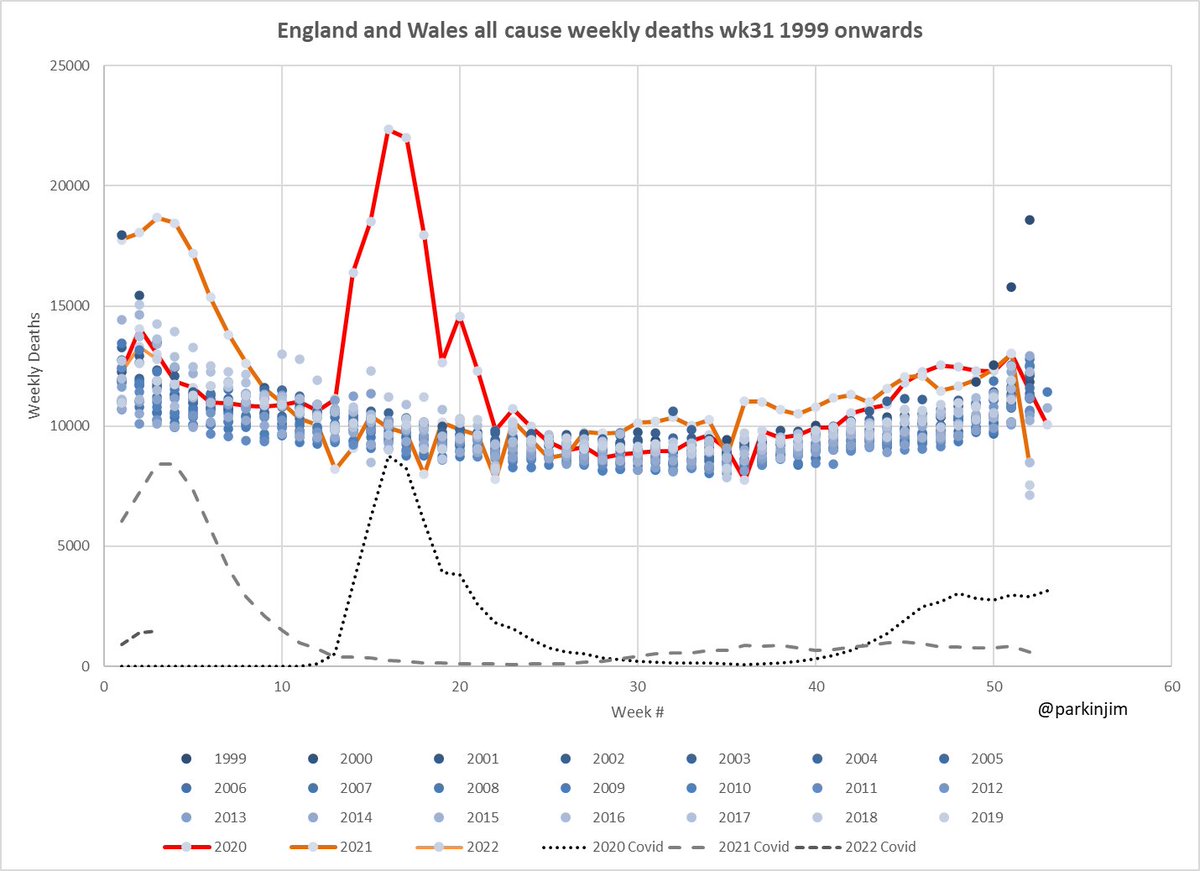
Before Christmas - from the summer up to week 50, 2021 was higher than any year except 2020 - sometimes higher
It was only 1999-2000 that was higher in the time in that graph
Re: Five Year Death Average For UK
Posted: Thu Feb 03, 2022 8:23 am
by jimbob
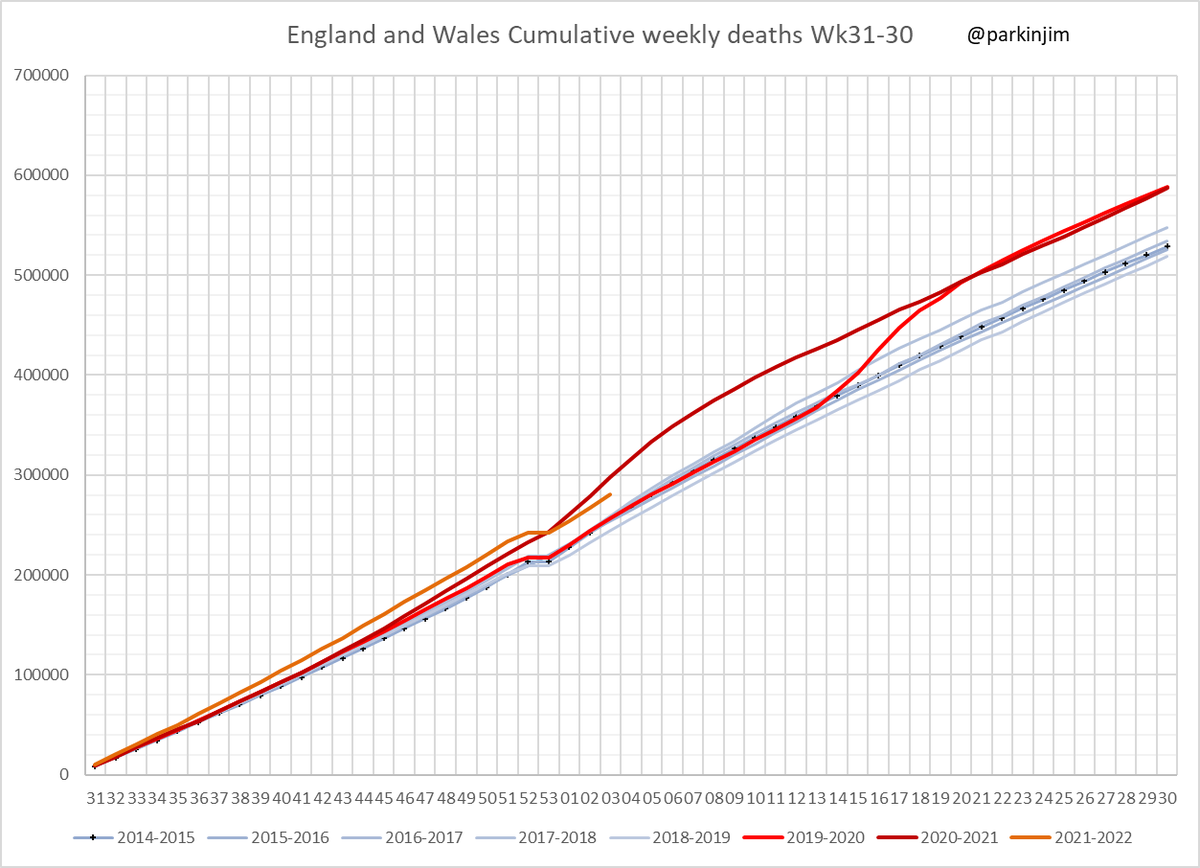
Screenshot 2022-02-03 082303.png (79.45 KiB) Viewed 7083 times
This shows the max, min and mean for 2015-2019 for comparison
I reckon it's your 3rd suggestion and what shpalman said - a lot of people who would have died this winter from the usual non-covid things people used to die of in winter, have already died with or because of covid [From the week ending 13 March 2020 to the week ending 21 January 2022, the number of excess deaths above the five-year average in England and Wales was 125,627].
I heard an epidemiologist use a really grim term for this . . . "early harvest".
Re: Five Year Death Average For UK
Posted: Thu Feb 03, 2022 10:44 am
by Fishnut
I'm pretty sure More or Less had an episode on early harvest around the end of the first lockdown.
I'm wondering how much "early harvest" is behind the view that omicron is milder.
I'm thinking that reinfections and vaccination might be.
Yeah, that's a major factor as well.
Aside from vaccination, I'm assuming that it's preferentially affecting people who were taking fewer precautions throughout (whether by choice or not), so it's more likely reinfection, and also affecting the populations that saw the highest death rates of vulnerable people from earlier variants.
I'm pretty sure More or Less had an episode on early harvest around the end of the first lockdown.
There hasn't been much evidence of it so far.
It's worth pointing out that the 2017-18 line (the one that is slightly higher than the Covid years) has been claimed to be a very bad winter by those who deny Covid's impact.
I can't see a line there that is higher than any point during CoVID? CoVID didn't start until week 10ish of 2020.
It's worth pointing out that the 2017-18 line (the one that is slightly higher than the Covid years) has been claimed to be a very bad winter by those who deny Covid's impact.
I can't see a line there that is higher than any point during CoVID? CoVID didn't start until week 10ish of 2020.
I've changed the formatting slightly - remember that I started at wk31 as I wanted each winter to be continuous (the flat bit on most years is for wk53)
2018 is a bit higher than the rest, but swamped by Covid.
I'm wondering how much "early harvest" is behind the view that omicron is milder.
It is even milder here where we had relatively few deaths. Prior to omicron, for those in their 60s, there was 1 death for every 50 cases recorded. Post omicron it is 1 death for every 846 cases.
Covid deaths Australia.jpg (112.95 KiB) Viewed 6927 times
98% of those aged in their 60s have 2 COVID vaccinations. I would put the change down to that.
5 to 11 year olds only started vaccinations 2 weeks ago and their ratio of cases to deaths has not moved as much as every other age group.
Being over 90 remains a very significant risk of death.
The Economist has an article in the current issue saying:
Royal College of Emergency Medicine published an estimate that delays in A&E are causing 300-500 excess deaths per week. Admits that it is a rough estimate. This used some source data from a paper published in Emergency Medicine Journal in early 22.
The Economist did some of its own modelling work using more recent data, giving similar estimates.
ONS data shows excess deaths persistently about 1500/wk above 2016-19 average since mid 21, apart from a dip of about 3 months in early 22 when it returned to average for that period. So that suggests, very roughly, that delays in A&E are responsible for about 20%-30% of that.
Re: Five Year Death Average For UK
Posted: Wed Jan 18, 2023 9:50 am
by Woodchopper
I wondered whether this is specific to the UK or more general. If UK specific then problems with the NHS and social care would be a likley cause. If more general then perhaps other things may be the cause (eg long term damage to lungs from Covid infection in 2020-2021 leading to excess mortality in 2022).
Across all European countries covered there has been significant excess mortality in the latter half of 2020 compared to a similar period in 2017, 2018, 2019. That severe excess mortality in Q3 and Q4 2022 is found among all age groups above 45, and seems to be worse among people aged over 75.
Looking at the scores by country and again at the second half of 2020, it looks like the worst excess mortality is found in Germany, Italy, Spain and England. Excess mortality was also persistently increased in Austria, Belgium, Estonia, Finland, France, Netherlands, Portugal, Slovenia, Sweden, Switzerland, Northern Ireland, Wales. But it didn't seem to be raised in Cyprus, Denmark, Greece, Ireland, Luxembourg, Malta, Scotland. I'm looking at the record over the six months and have ignored single bumps as epidemics are to be expected.
All that is very preliminary and just based upon eyeballing the graphs. But it looks like there is a European problem with excess mortality and the UK isn't a serious outlier. England is bad, but not obviously worse than Germany, Italy or Spain. Scotland, Northern Ireland and Wales don't seem to be much worse than other European states.
The important question should be what are Ireland, Cyprus, Denmark or Scotland doing right? Maybe being a small country matters (eg healthcare can be more responsive to changing situations).