https://www.theguardian.com/world/2020/ ... igures-sayshpalman wrote: ↑Sun May 10, 2020 11:04 amIf Lombardy were a separate country it would be way ahead on that measure. Nearly 15000 deaths out of a population of 10 million is worse even than Belgium (about 8,600 out of 11.5 million). I see 5530 for London here (population 8.9 million).Aitch wrote: ↑Sun May 10, 2020 10:17 amAh but according to, I think, Dr Fox on Radio 4 this morning, we're only 4th or 5th if you use standardised figures - ie deaths per total population.shpalman wrote: ↑Sun May 10, 2020 9:11 am
So the cases which got infected around that time, thanks to the lockdown not being strict enough because the scientists argued against it, would have been the ones which pushed the UK into overtaking Italy.
We should be criticising this government for all sorts of things but not, I don't think, for making the lockdown too strict.
I failed stats a long time ago, so I don't know how truthful he was being.
But Italy as a whole is on 30395 with about 240 per day while the UK is on 31587 with about 490 per day so not long now until the UK beats Italy in terms of deaths per total population too, especially if the government considers relaxing some of the lockdown or if everyone just decides to go and hang out at the park anyway.
I also suspect that Italy had most of its deaths-due-to-covid-which-weren't-attributed-to-covid-at-the-time back in March whereas the UK is still having them, so the UK will end up way ahead of Italy when then the final excess deaths are counted. But I'm just making that up.
COVID-19
-
shpalman

- Princess POW
- Posts: 8266
- Joined: Mon Nov 11, 2019 12:53 pm
- Location: One step beyond
- Contact:
Re: COVID-19
having that swing is a necessary but not sufficient condition for it meaning a thing
@shpalman@mastodon.me.uk
@shpalman@mastodon.me.uk

Re: COVID-19
WTF goes on in meatpacking plants? Why would every one of them have massive outbreaks, when ordinary factories don't?
 Awarded gold star 4 November 2021
-
Gentleman Jim

- Catbabel
- Posts: 634
- Joined: Mon Nov 11, 2019 9:38 pm
Re: COVID-19
Yeah but its getting all that agreed by those bastards at the regulatory agenciestom p wrote: ↑Tue May 12, 2020 8:53 amI knew you'd know more about it than me!Gentleman Jim wrote: ↑Tue May 12, 2020 8:39 amMight put a strain on the packaging etc pipeline as all supplies are "just in time" but I agree about the factory/machinery - any change from the normal type vaccine delivery would probably cause havoc in the health care systemtom p wrote: ↑Tue May 12, 2020 7:48 amI would be astonished if pharma companies' factories, in terms of walls, roof, electricity, water, offices for managers, and HR, toilets, changing rooms so staff can get into and out of their PPE before and after shift, canteen, etc. even staff, aren't basically interchangeable, with the only real differences being of scale. Filling it with appropriate machines for making the active component of the vaccine will need to be done afterwards, but that's a relatively small step.
We also actually already have a few ideas of what the vaccine will look like. The EMA has been working with pharma companies to pre-approve all the usual bits - solution, containers, packaging, adjuvants etc so that if it's a standard vaccine, the approval phase almost only needs to check safety and efficacy & most of the quality bits are done. Sure, it might be a vaccine that is best delivered as an intra-nasal spray, but it's most likely to be an IM injection that comes in individual pre-packed sterile doses or small vials for doctors/nurses to extract from.
The biggest problems would be if the new vaccine required substantially different manufacturing conditions. Virtually all are made in large steel tanks of various sizes depending on amount of vaccine required. Secondly, manufacturing schedules are set up months in advance and utilise the whole capacity of the plant. To suddenly switch to producing covid vaccine without new capital equipment would inevitably lead to shortages of other vaccines, at least in the short term
Even though supplies are normally just in time, I presume there's nothing to stop an organisation sourcing and putting in an order for 6-12 months time to build up a stockpile in advance of a vaccine's anticipated approval if they wanted to, is there? After all, that's the timescale we're working on here, in the best case scenario.
With some sensible planning and goodwill all round, there's no reason why there should be any risk of money wasted (apart from the cost of transporting the goods). Buy the packaging materials, stockpile them and monitor when they will expire. Have agreements in place with some MAHs that if we get within 6 months of the expiry date of the packaging without a coronovirus vaccine in sight, they will buy them for seasonal flu or something else that is gonna get used shortly and we will take the JiT stocks they were gonna buy. That way we always have stocks ready and the packaging materials are never wasted. Might be a slight loss on shipping, but only slight. Make everything completely public so there's a strong incentive for the MAH not to renege and f.ck us over and then job's a good 'un. All the prep is in place.
Rules are for the guidance of wise men and the obedience of fools.
-
Bird on a Fire

- Princess POW
- Posts: 10137
- Joined: Fri Oct 11, 2019 5:05 pm
- Location: Portugal
Re: COVID-19
Wired did an article on this. ETA link https://www.wired.com/story/why-meatpac ... hot-spots/
According to the CDC’s latest report, the chief risks to meatpackers come from being in prolonged close proximity to other workers. A thousand people might work a single eight-hour shift, standing shoulder to shoulder as carcasses whiz by on hooks or conveyor belts. Often, workers get only a second or two to complete their task before the next hunk of meat arrives. The frenzied pace and grueling physical demands of breaking down so many dead animals can make people breathe hard and have difficulty keeping masks properly positioned on their faces. To allow for social distancing, the agency recommended that meat processors slow down production lines to require fewer workers, and that they stagger shifts to limit the number of employees in a facility at one time.
And meat processing plants have other unique characteristics that are trickier to modify, like the very cold temperatures and aggressive ventilation systems required to prevent meat from spoiling or getting contaminated with pathogens that cause foodborne illness. These features could also be contributing to the high rates of infection among slaughterhouse workers, says Sima Asadi, a chemical engineer at UC Davis. “Low temperatures allow the virus to stay viable outside the body for longer, increasing the survival of the virus in the air,” she says. “That really increases the risk of infection in these plants.”
Eating enormous numbers of animals is looking increasingly moronic, on top of the obvious ethical problems.But the physical conditions inside these plants probably aren’t the whole story. Social and economic factors likely play a role, too. Meat processing is an exhausting, dangerous, labor-intensive job done primarily by underpaid, undocumented workers and recent immigrants to the US. Out of necessity, many of them live in multigenerational homes or other crowded housing environments. They may also ride company-operated busses for an hour or more each day to and from the plants—usually located in very rural areas—which again puts them in prolonged close contact with other people. Other types of farmworkers, including those who pick fruits and vegetables, face similar challenges when it comes to social distancing at home, in the fields, and in between.
If they do become sick, the workers often lack access to testing and health care, which means they might accidentally spread the disease or continue clocking in until their symptoms become so bad they can’t work. Many don’t have phones or are fearful of providing phone numbers that might aid teams of contact tracers investigating an infection. Their undocumented status makes them less likely to seek medical care if they do get sick, particularly under the Trump administration’s restrictive immigration policies. All of these factors—on top of the realities of working in a giant refrigerator slick with water and blood and packed with human and animal bodies—make meat processing workers a particularly vulnerable population where the coronavirus has now found a foothold.
Last edited by Bird on a Fire on Tue May 12, 2020 3:35 pm, edited 1 time in total.
Reason: add link
Reason: add link
We have the right to a clean, healthy, sustainable environment.
-
El Pollo Diablo

- Stummy Beige
- Posts: 3324
- Joined: Wed Sep 25, 2019 4:41 pm
- Location: FBPE
Re: COVID-19
I did a blog on using population to normalise coronavirus deaths, and why it's daft
https://thingssamthinks.wordpress.com/2 ... -19-cases/
https://thingssamthinks.wordpress.com/2 ... -19-cases/
If truth is many-sided, mendacity is many-tongued
-
FlammableFlower
- Dorkwood
- Posts: 1509
- Joined: Mon Nov 11, 2019 1:22 pm
Re: COVID-19
Working in a meat factory (Chard - the one that Tom Holt notes being downwind of in his author blurb) was my shortest job - it was bl..dy cold and as you link says - fast-paced. I got taken off the (shoulder-to-shoulder, very close proximity) kebab line (which took me away from the joys of getting mustard grains under my fingernails) and off to a section jointing pigs, armed with a large hacksaw. Whilst less tortuous, it was very physical and no less fast-paced. Since the agency pay was soooooo little, I jumped ship after 3 days.Bird on a Fire wrote: ↑Tue May 12, 2020 3:15 pmWired did an article on this. ETA link https://www.wired.com/story/why-meatpac ... hot-spots/
According to the CDC’s latest report, the chief risks to meatpackers come from being in prolonged close proximity to other workers. A thousand people might work a single eight-hour shift, standing shoulder to shoulder as carcasses whiz by on hooks or conveyor belts. Often, workers get only a second or two to complete their task before the next hunk of meat arrives. The frenzied pace and grueling physical demands of breaking down so many dead animals can make people breathe hard and have difficulty keeping masks properly positioned on their faces. To allow for social distancing, the agency recommended that meat processors slow down production lines to require fewer workers, and that they stagger shifts to limit the number of employees in a facility at one time.And meat processing plants have other unique characteristics that are trickier to modify, like the very cold temperatures and aggressive ventilation systems required to prevent meat from spoiling or getting contaminated with pathogens that cause foodborne illness. These features could also be contributing to the high rates of infection among slaughterhouse workers, says Sima Asadi, a chemical engineer at UC Davis. “Low temperatures allow the virus to stay viable outside the body for longer, increasing the survival of the virus in the air,” she says. “That really increases the risk of infection in these plants.”Eating enormous numbers of animals is looking increasingly moronic, on top of the obvious ethical problems.But the physical conditions inside these plants probably aren’t the whole story. Social and economic factors likely play a role, too. Meat processing is an exhausting, dangerous, labor-intensive job done primarily by underpaid, undocumented workers and recent immigrants to the US. Out of necessity, many of them live in multigenerational homes or other crowded housing environments. They may also ride company-operated busses for an hour or more each day to and from the plants—usually located in very rural areas—which again puts them in prolonged close contact with other people. Other types of farmworkers, including those who pick fruits and vegetables, face similar challenges when it comes to social distancing at home, in the fields, and in between.
If they do become sick, the workers often lack access to testing and health care, which means they might accidentally spread the disease or continue clocking in until their symptoms become so bad they can’t work. Many don’t have phones or are fearful of providing phone numbers that might aid teams of contact tracers investigating an infection. Their undocumented status makes them less likely to seek medical care if they do get sick, particularly under the Trump administration’s restrictive immigration policies. All of these factors—on top of the realities of working in a giant refrigerator slick with water and blood and packed with human and animal bodies—make meat processing workers a particularly vulnerable population where the coronavirus has now found a foothold.

Re: COVID-19
Everyone knows someone who once worked in a meat packing plant. 
Time for a big fat one.
-
shpalman
- Princess POW
- Posts: 8266
- Joined: Mon Nov 11, 2019 12:53 pm
- Location: One step beyond
- Contact:
Re: COVID-19
I think the UK government can’t help but think in terms of the “peak” being equivalent to the one you’d get in an epidemiological model once a substantial fraction of the population had been infected, and not the difference between increasing infections before a lockdown and decreasing infections because of a lockdown. You can’t relax the lockdown right after the peak, you have to wait *until the actual number of infections has gone down enough* that you can test-trace-treat the small number of new cases which will come up afterwards.El Pollo Diablo wrote: ↑Tue May 12, 2020 3:27 pmI did a blog on using population to normalise coronavirus deaths, and why it's daft
https://thingssamthinks.wordpress.com/2 ... -19-cases/
having that swing is a necessary but not sufficient condition for it meaning a thing
@shpalman@mastodon.me.uk
@shpalman@mastodon.me.uk
-
shpalman
- Princess POW
- Posts: 8266
- Joined: Mon Nov 11, 2019 12:53 pm
- Location: One step beyond
- Contact:
Re: COVID-19
- covid-causes_2020-05-12.jpg (67.37 KiB) Viewed 3438 times
(The categories in the figure are, in order: other/religious community/cruise ship/work/hospital/family/care home)
* RSA = residenza sanitarie assistenziali
** INAIL = national institute for insurance against workplace incidents
having that swing is a necessary but not sufficient condition for it meaning a thing
@shpalman@mastodon.me.uk
@shpalman@mastodon.me.uk
-
Woodchopper

- Princess POW
- Posts: 7075
- Joined: Sat Oct 12, 2019 9:05 am
Re: COVID-19
https://www.hsj.co.uk/coronavirus/exclu ... 19.articleData on the outcome of tens of thousands of tests carried out outside the NHS is ‘disappearing into a data black hole’, making it harder for local organisations to respond to the spread of coronavirus in their area.
An internal NHS update email seen by HSJ, which is meant to tell local organisations how many residents and staff in their areas have tested positive, states that full information is “increasingly becoming unavailable” and cannot be reported “until further notice”.
Instead the reporting is based only on NHS lab tests, which make up less than half of total tests now being carried out, a proportion which is still shrinking further.

Re: COVID-19
So my startup is creating a new numerical modelling and analytics tool. We ran the John Hopkins Covid numbers today as a use case. The Y axis is reported cases per million population, the X-axis is number of days since 10 cases/million. Look at the slopes. The best that can be said for the UK and USA is that it now seems to be linear rather than exponential.
- Attachments
-
- CovidSlopes.png (173.3 KiB) Viewed 3374 times
-
El Pollo Diablo
- Stummy Beige
- Posts: 3324
- Joined: Wed Sep 25, 2019 4:41 pm
- Location: FBPE
Re: COVID-19
As I wrote in my blog above, I think normalising by population is the wrong thing to do here, sorry.
(see here)
Some potentially interesting ways to normalise it would be by urbanised population (still problematic) or by date since and strength of lockdown.
(see here)
Some potentially interesting ways to normalise it would be by urbanised population (still problematic) or by date since and strength of lockdown.
If truth is many-sided, mendacity is many-tongued
Re: COVID-19
My point was the slope of infections/million indicates how well you are controlling the spread, even if the actual value is problematic. The UK (and US) haven't flattened it and are easing restrictions.El Pollo Diablo wrote: ↑Wed May 13, 2020 11:08 amAs I wrote in my blog above, I think normalising by population is the wrong thing to do here, sorry.
(see here)
Some potentially interesting ways to normalise it would be by urbanised population (still problematic) or by date since and strength of lockdown.
-
shpalman
- Princess POW
- Posts: 8266
- Joined: Mon Nov 11, 2019 12:53 pm
- Location: One step beyond
- Contact:
Re: COVID-19
You would be able to see if the curve were flattening on any scale, but for that it's better to plot new cases per day (or per week since Italy and the UK definitely have a weekly rhythm for reporting cases).bjn wrote: ↑Wed May 13, 2020 11:38 amMy point was the slope of infections/million indicates how well you are controlling the spread, even if the actual value is problematic. The UK (and US) haven't flattened it and are easing restrictions.El Pollo Diablo wrote: ↑Wed May 13, 2020 11:08 amAs I wrote in my blog above, I think normalising by population is the wrong thing to do here, sorry.
(see here)
Some potentially interesting ways to normalise it would be by urbanised population (still problematic) or by date since and strength of lockdown.
having that swing is a necessary but not sufficient condition for it meaning a thing
@shpalman@mastodon.me.uk
@shpalman@mastodon.me.uk
Re: COVID-19
Your chart is quite nice, but doesn't have colours that can be distinguished. The order of the legend should coordinate with the lines (see Our World in Data for a good example) and you can use combinations of solid, dashed and marked lines to make it clear.
On methodology, read Diablo, E. P. (2020) for useful information on unicorns, plus why per million population is less relevant when only 4% to 10% of any country has been infected.
B-.
On methodology, read Diablo, E. P. (2020) for useful information on unicorns, plus why per million population is less relevant when only 4% to 10% of any country has been infected.
B-.
Awarded gold star 4 November 2021-
shpalman
- Princess POW
- Posts: 8266
- Joined: Mon Nov 11, 2019 12:53 pm
- Location: One step beyond
- Contact:
Re: COVID-19
If you took Italy's number of cases and divided by the population of Italy you'd get one number; half of Italy's cases are in a sixth of the population (Lombardy). Which is the correct "number of cases per million of population" to use?
This way of plotting emphasises the natural dynamics of the disease; it would be interesting to analyse that to see if the level at which each country peaks has more to do with when each lockdown was enacted (i.e. in terms of the number of cases which motivated each national government to enact lockdown measures, since the data here is not explicitly plotted against data) or if the peak height is proportional to the population of the country.
This way of plotting emphasises the natural dynamics of the disease; it would be interesting to analyse that to see if the level at which each country peaks has more to do with when each lockdown was enacted (i.e. in terms of the number of cases which motivated each national government to enact lockdown measures, since the data here is not explicitly plotted against data) or if the peak height is proportional to the population of the country.
having that swing is a necessary but not sufficient condition for it meaning a thing
@shpalman@mastodon.me.uk
@shpalman@mastodon.me.uk
-
Woodchopper
- Princess POW
- Posts: 7075
- Joined: Sat Oct 12, 2019 9:05 am
Re: COVID-19
I think there is a use to it.El Pollo Diablo wrote: ↑Wed May 13, 2020 11:08 amAs I wrote in my blog above, I think normalising by population is the wrong thing to do here, sorry.
(see here)
Some potentially interesting ways to normalise it would be by urbanised population (still problematic) or by date since and strength of lockdown.
As you write, the purpose of lockdowns and social distancing is to minimize the proportion of the population that has been infected. However, we don't yet have a good way to measure what per cent of people have been infected. To do that we'd need to be much better at testing random samples etc.
Deaths or hospitalizations per 100 000 is a crude way to get an idea of the proportion that have been infected. For example, the UK has 492 deaths per 100 000 and Finland has 49 per 100 000. We can't calculate the proportion infected in each country (not without a much more precise measure of the IFR in each). But we can assume that a higher percentage of the population in the UK has been infected compared to Finland.
Its pretty crude, but it tells us more about the proportion infected than the absolute number of deaths per country. [ETA: as you write total excess deaths is probably the best measure to use when calculating rates per 100 000]. Such an comparison would best be made between places with fairly similar healthcare and population demographics (particularly age), there's not much to be gained by comparing rates per 100 000 in the UK and Uganda.

Re: COVID-19
For those of us that have colour perception deficiency, would it be possible to have the colour key ordered on a 'current Max to Min' basis ? I'm finding it difficult to differentiate which lines represent UK, Portugal and Belgium as one group, and between Spain and Netherlands as another.bjn wrote: ↑Wed May 13, 2020 10:51 amSo my startup is creating a new numerical modelling and analytics tool. We ran the John Hopkins Covid numbers today as a use case. The Y axis is reported cases per million population, the X-axis is number of days since 10 cases/million. Look at the slopes. The best that can be said for the UK and USA is that it now seems to be linear rather than exponential.
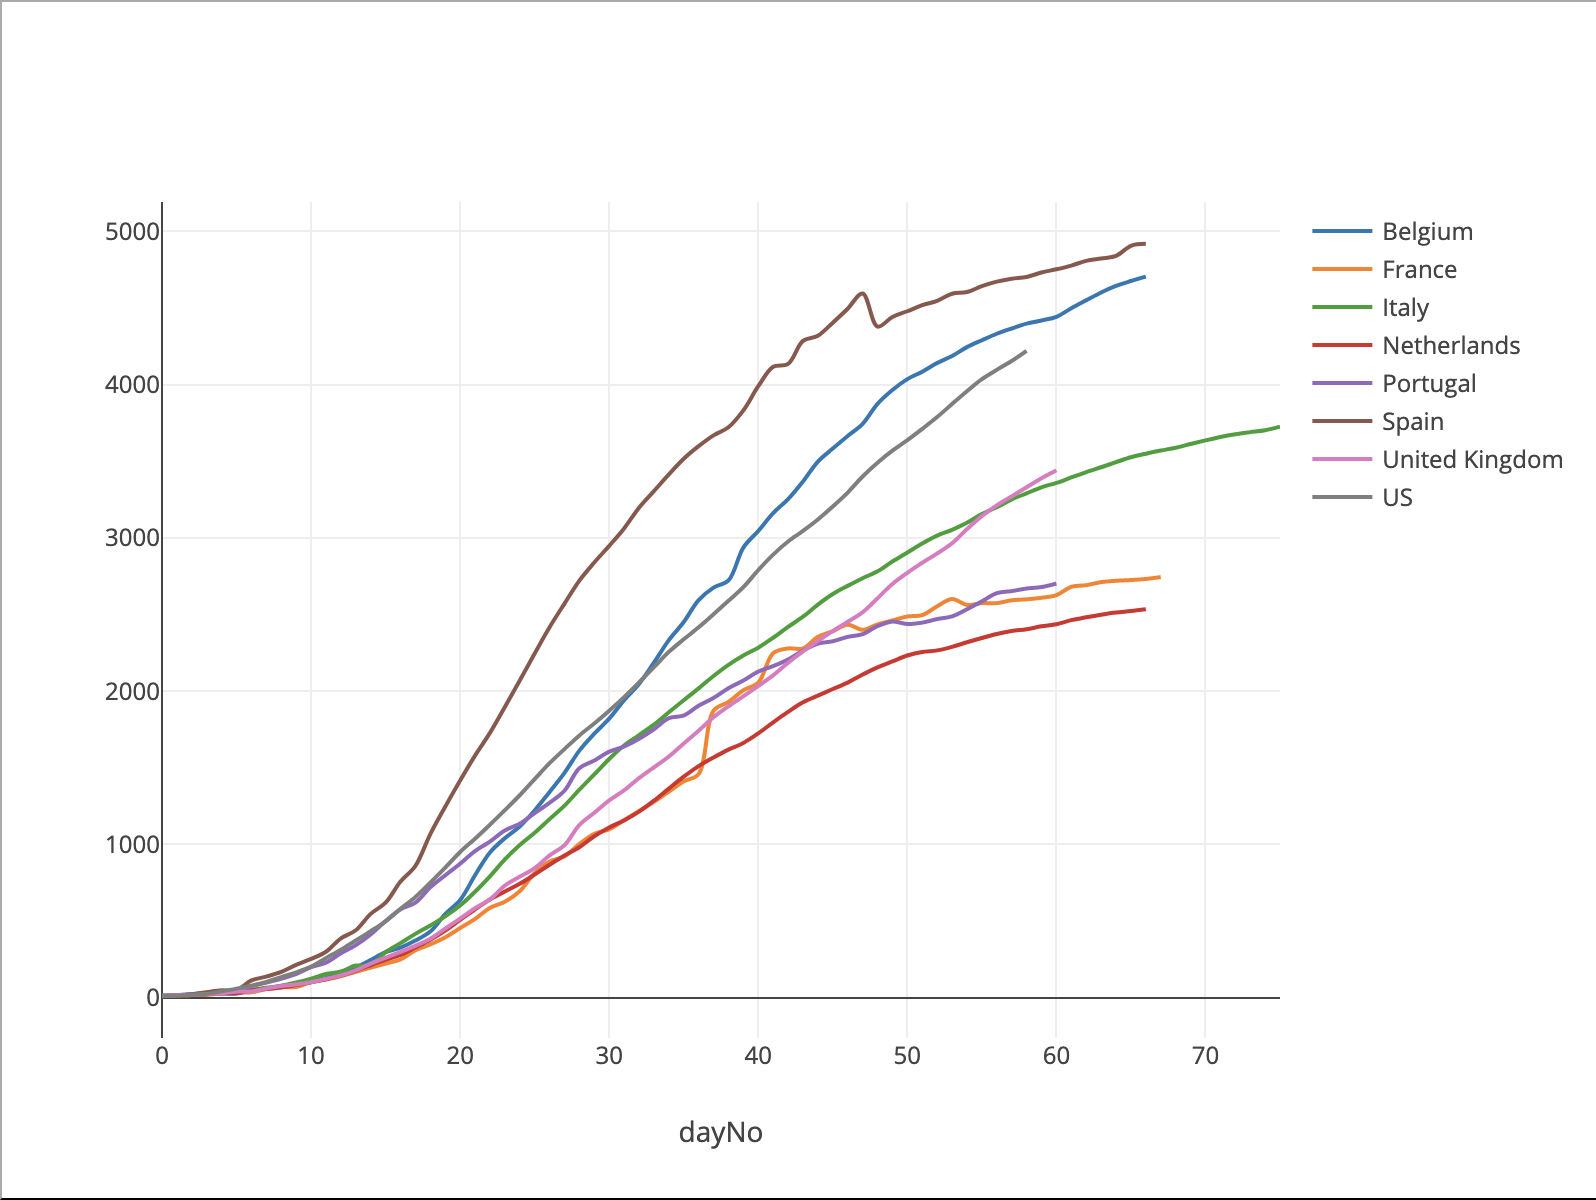
If you can't it's not a biggie, but it's a relatively common problem that many people aren't aware of.
My avatar was a scientific result that was later found to be 'mistaken' - I rarely claim to be 100% correct
ETA 5/8/20: I've been advised that the result was correct, it was the initial interpretation that needed to be withdrawn
Meta? I'd say so!
ETA 5/8/20: I've been advised that the result was correct, it was the initial interpretation that needed to be withdrawn
Meta? I'd say so!
-
shpalman
- Princess POW
- Posts: 8266
- Joined: Mon Nov 11, 2019 12:53 pm
- Location: One step beyond
- Contact:
Re: COVID-19
What insight is to be gained in comparing the UK and Finland in your example?Woodchopper wrote: ↑Wed May 13, 2020 12:08 pmI think there is a use to it.El Pollo Diablo wrote: ↑Wed May 13, 2020 11:08 amAs I wrote in my blog above, I think normalising by population is the wrong thing to do here, sorry.
(see here)
Some potentially interesting ways to normalise it would be by urbanised population (still problematic) or by date since and strength of lockdown.
As you write, the purpose of lockdowns and social distancing is to minimize the proportion of the population that has been infected. However, we don't yet have a good way to measure what per cent of people have been infected. To do that we'd need to be much better at testing random samples etc.
Deaths or hospitalizations per 100 000 is a crude way to get an idea of the proportion that have been infected. For example, the UK has 492 deaths per 100 000 and Finland has 49 per 100 000. We can't calculate the proportion infected in each country (not without a much more precise measure of the IFR in each). But we can assume that a higher percentage of the population in the UK has been infected compared to Finland.
Its pretty crude, but it tells us more about the proportion infected than the absolute number of deaths per country. [ETA: as you write total excess deaths is probably the best measure to use when calculating rates per 100 000]. Such an comparison would best be made between places with fairly similar healthcare and population demographics (particularly age), there's not much to be gained by comparing rates per 100 000 in the UK and Uganda.
There may be some epidemiological reason why a country with a lower population will have fewer deaths per 100 000, possibly due to population density.
having that swing is a necessary but not sufficient condition for it meaning a thing
@shpalman@mastodon.me.uk
@shpalman@mastodon.me.uk
Re: COVID-19
Per million population is good for knowing what resources you'll need, because obvs UK has more hospital beds than Finland. It's the basis for "how close to breaking point is our health service" comparisons.
Awarded gold star 4 November 2021-
shpalman
- Princess POW
- Posts: 8266
- Joined: Mon Nov 11, 2019 12:53 pm
- Location: One step beyond
- Contact:
Re: COVID-19
But you can just look at the absolute numbers of cases and absolute numbers of beds.
I have a suspicion that the early lack of a quantitative and relevant y-axis on the graphs (until that Imperial College report) is why the government didn't notice that the herd immunity strategy would have required hundreds of thousands of ICU beds.
having that swing is a necessary but not sufficient condition for it meaning a thing
@shpalman@mastodon.me.uk
@shpalman@mastodon.me.uk
Re: COVID-19
Not yet. It was more an exercise in being able to actually live load and process the data set in question. The thing that surprised us most was the slope for the UK and US curves.Gfamily wrote: ↑Wed May 13, 2020 12:20 pmFor those of us that have colour perception deficiency, would it be possible to have the colour key ordered on a 'current Max to Min' basis ? I'm finding it difficult to differentiate which lines represent UK, Portugal and Belgium as one group, and between Spain and Netherlands as another.bjn wrote: ↑Wed May 13, 2020 10:51 amSo my startup is creating a new numerical modelling and analytics tool. We ran the John Hopkins Covid numbers today as a use case. The Y axis is reported cases per million population, the X-axis is number of days since 10 cases/million. Look at the slopes. The best that can be said for the UK and USA is that it now seems to be linear rather than exponential.
If you can't it's not a biggie, but it's a relatively common problem that many people aren't aware of.
Re: COVID-19
That's fine. Always good to see what's technically possible.
The fine details of the UI will depend on your target audience, and can come later.
My avatar was a scientific result that was later found to be 'mistaken' - I rarely claim to be 100% correct
ETA 5/8/20: I've been advised that the result was correct, it was the initial interpretation that needed to be withdrawn
Meta? I'd say so!
ETA 5/8/20: I've been advised that the result was correct, it was the initial interpretation that needed to be withdrawn
Meta? I'd say so!
-
plebian
Re: COVID-19
I wouldn't have said anything but my colour blindness makes distinguishing all those thin lines in various pastel hues impossible for me.lpm wrote: ↑Wed May 13, 2020 11:51 amYour chart is quite nice, but doesn't have colours that can be distinguished. The order of the legend should coordinate with the lines (see Our World in Data for a good example) and you can use combinations of solid, dashed and marked lines to make it clear.
On methodology, read Diablo, E. P. (2020) for useful information on unicorns, plus why per million population is less relevant when only 4% to 10% of any country has been infected.
B-.
I've likes that most country comparison graphs so far have had the country label on the line.
-
Woodchopper
- Princess POW
- Posts: 7075
- Joined: Sat Oct 12, 2019 9:05 am
Re: COVID-19
If if someone is trying to work out the best means to deal with infection it might be useful to compare two or more countries. It would be easy to control for things like population density.shpalman wrote: ↑Wed May 13, 2020 12:21 pmWhat insight is to be gained in comparing the UK and Finland in your example?Woodchopper wrote: ↑Wed May 13, 2020 12:08 pmI think there is a use to it.El Pollo Diablo wrote: ↑Wed May 13, 2020 11:08 amAs I wrote in my blog above, I think normalising by population is the wrong thing to do here, sorry.
(see here)
Some potentially interesting ways to normalise it would be by urbanised population (still problematic) or by date since and strength of lockdown.
As you write, the purpose of lockdowns and social distancing is to minimize the proportion of the population that has been infected. However, we don't yet have a good way to measure what per cent of people have been infected. To do that we'd need to be much better at testing random samples etc.
Deaths or hospitalizations per 100 000 is a crude way to get an idea of the proportion that have been infected. For example, the UK has 492 deaths per 100 000 and Finland has 49 per 100 000. We can't calculate the proportion infected in each country (not without a much more precise measure of the IFR in each). But we can assume that a higher percentage of the population in the UK has been infected compared to Finland.
Its pretty crude, but it tells us more about the proportion infected than the absolute number of deaths per country. [ETA: as you write total excess deaths is probably the best measure to use when calculating rates per 100 000]. Such an comparison would best be made between places with fairly similar healthcare and population demographics (particularly age), there's not much to be gained by comparing rates per 100 000 in the UK and Uganda.
There may be some epidemiological reason why a country with a lower population will have fewer deaths per 100 000, possibly due to population density.