- Screenshot 2020-11-15 at 16.28.05.png (15.72 KiB) Viewed 3006 times
COVID-19
Re: COVID-19
Oh  . I may have to hand in my cock-eyed optimist card. On the latest UK figures I think I am maybe perhaps beginning to see, after two or three weeks flat, suggestions of a rise in the rate of cases (by specimen date) and of hospital admissions. Ten days into the lock-down I was hoping to see declines.
Or perhaps it's just the rain making me pessimistic.
. I may have to hand in my cock-eyed optimist card. On the latest UK figures I think I am maybe perhaps beginning to see, after two or three weeks flat, suggestions of a rise in the rate of cases (by specimen date) and of hospital admissions. Ten days into the lock-down I was hoping to see declines.
Or perhaps it's just the rain making me pessimistic.
-
Bird on a Fire

- Princess POW
- Posts: 10142
- Joined: Fri Oct 11, 2019 5:05 pm
- Location: Portugal
Re: COVID-19
They're certainly running out of rhetorical runway.JQH wrote: ↑Sun Nov 15, 2020 3:55 pmCertainly seems to be the Trumpist attitude. I can't see how else they get to believing Joe Biden is a socialist.Bird on a Fire wrote: ↑Sun Nov 15, 2020 2:35 pmAh yes, leftism is when the government does things, and the more things the government does the more left it is.
Which makes me wonder what they would have called Bernie Sanders if he'd got the nomination.
Mind you, even the Democrats didn't seem to realise that Sanders was just proposing normal European policies rather than anything radically leftist in a developed-world context.
I'm not normally a fan of intrusive government (despite being leftish) but dealing with pandemics does seem to be one area where top-down imposition of rules that, regrettably, infringe people's civil liberties is actually quite useful for saving lives. You don't have to go full-on totalitarian about it, but Oz and NZ seem to have done a decent job compared to other wealthy island nations I could mention
We have the right to a clean, healthy, sustainable environment.

Re: COVID-19
I actually think that we're near or maybe over the peak as far as cases are concernedKAJ wrote: ↑Sun Nov 15, 2020 4:35 pmOh
Screenshot 2020-11-15 at 16.28.05.png
Or perhaps it's just the rain making me pessimistic.
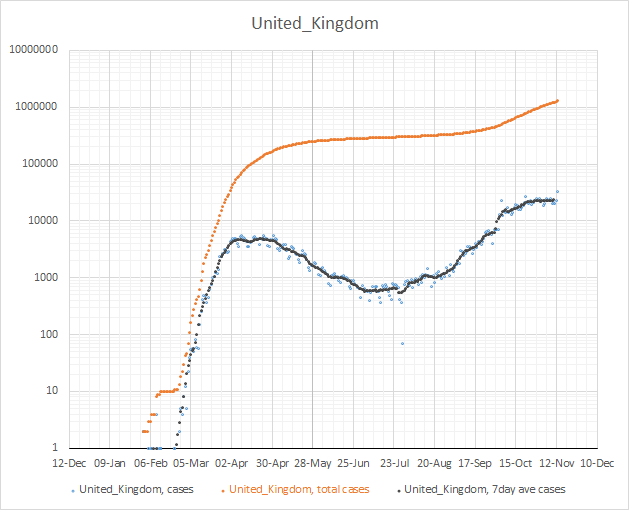
And that the rise in deaths might be starting to slow too. Still rising though.
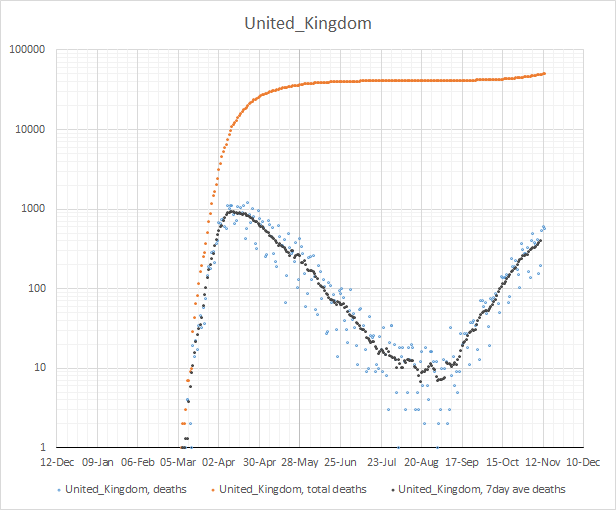
Again this is the ECDC by date reported, with centred 7-day averages in black so the date is the morning after the UK date (e.g. the 25th September was reported around 4pm on 24th on the UK COVID dashboard)
https://www.ecdc.europa.eu/en/publicati ... -worldwide
Have you considered stupidity as an explanation
Re: COVID-19
I'm getting tired of people denying that lockdowns reduce the infections.
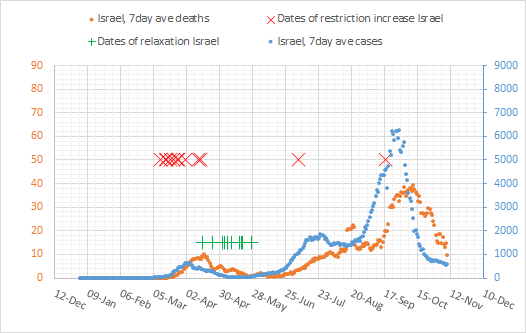
I still think that Israel is the poster child for getting the first wave under control with increasing restrictions, relaxing too soon (at about 10 cases per day) and then needing a second lockdown to cause cases and deaths to fall again.
But this is "That is associational twaddle - period."
https://twitter.com/FatEmperor/status/1 ... 9621677060
It's some weird form of misplaced ideal of proof that their opponents need but where assertions are just fine for them
Have you considered stupidity as an explanation
-
shpalman

- Princess POW
- Posts: 8317
- Joined: Mon Nov 11, 2019 12:53 pm
- Location: One step beyond
- Contact:
Re: COVID-19
I mean, the correct answer to "lockdown isn't working because cases* aren't going down" is to lockdown more, or at least to actually try following the lockdown measures. Or at least at least to note that numbers of new cases per day would still be going up exponentially, and they aren't.
* - number of new cases per day
* - number of new cases per day
having that swing is a necessary but not sufficient condition for it meaning a thing
@shpalman@mastodon.me.uk
@shpalman@mastodon.me.uk
-
sTeamTraen

- After Pie
- Posts: 2558
- Joined: Mon Nov 11, 2019 4:24 pm
- Location: Palma de Mallorca, Spain
Re: COVID-19
Sue Cook, former presenter of Crimewatch, has gone full frootloop.
Something something hammer something something nail
-
Hunting Dog
- Fuzzable
- Posts: 264
- Joined: Tue Nov 12, 2019 7:48 pm
Re: COVID-19
I really can't understand how she's posted that... the pic:sTeamTraen wrote: ↑Sun Nov 15, 2020 5:49 pmSue Cook, former presenter of Crimewatch, has gone full frootloop.
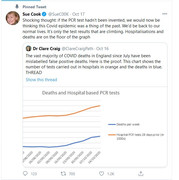
shows deaths going up so wtf is she on about with the test results going up and not the deaths?
- Attachments
-
- deaths.jpg (75.93 KiB) Viewed 2938 times
-
bob sterman

- Dorkwood
- Posts: 1143
- Joined: Mon Nov 11, 2019 10:25 pm
- Location: Location Location
Re: COVID-19
She appears to have fallen under the spell of Sikora, Heneghan and that diet guru bloke off Youtube...sTeamTraen wrote: ↑Sun Nov 15, 2020 5:49 pmSue Cook, former presenter of Crimewatch, has gone full frootloop.
Ex-BBC star Sue Cook, 71, accuses broadcaster of unbalanced Covid coverage and pushing too hard to shut down UK by forever 'wheeling out' 'Professor Lockdown' Neil Ferguson over other scientists
https://www.dailymail.co.uk/news/articl ... erage.html
The diet guru bloke (Cummins) is described as "Chief Program Officer for Irish Heart Disease Awareness" - which sounds very impressive. Except Irish Heart Disease Awareness has the same address as the one Cummins sells his diet guru books from.

Re: COVID-19
This was one of the things she was approvingly tweeting about: https://thehighwire.com/videos/pfizer-c ... ne-frenzy/
It's really quite something.
It's really quite something.
Re: COVID-19
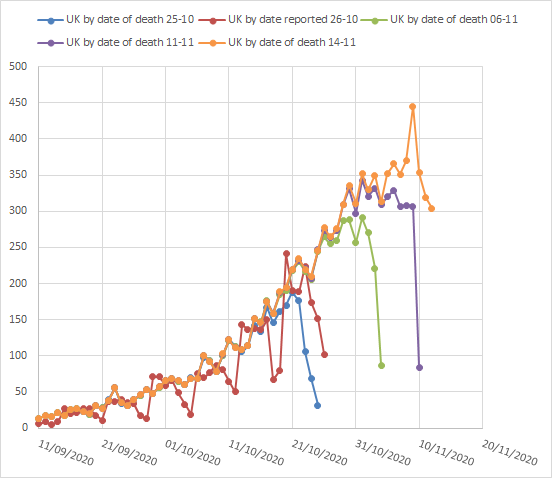
Yes, concentrating on more recent data makes more recent changes clearer. I think my post of Thursday 7:08 pm (based on data.gov.uk) strongly suggested that cases had plateaued. This chart of todays data on deaths by date of death ...jimbob wrote: ↑Sun Nov 15, 2020 5:03 pmI actually think that we're near or maybe over the peak as far as cases are concernedKAJ wrote: ↑Sun Nov 15, 2020 4:35 pmOh
Screenshot 2020-11-15 at 16.28.05.png
Or perhaps it's just the rain making me pessimistic.
<snip chart>
And that the rise in deaths might be starting to slow too. Still rising though.
<snip chart>
Again this is the ECDC by date reported, with centred 7-day averages in black so the date is the morning after the UK date (e.g. the 25th September was reported around 4pm on 24th on the UK COVID dashboard)
https://www.ecdc.europa.eu/en/publicati ... -worldwide
- Deaths.png (5.96 KiB) Viewed 2917 times
I'd expected/hoped the current lock-down to cause a decline in cases about now. In my post of 4:35 today a quick eyeball made me think numbers might in fact be rising - perhaps due to pre-lockdown splurges. A closer look suggests my pessimism is unfounded.
Here I've fitted a quadratic (to reflect the plateauing) with a day-of-week factor.
- XYplot2.png (16.42 KiB) Viewed 2917 times
Code: Select all
Residuals:
     Min       1Q   Median       3Q      Max
-0.18239 -0.05675 -0.02204  0.06101  0.18769

Coefficients:
                        Estimate Std. Error t value Pr(>|t|)
(Intercept)              9.75039    0.03614 269.764  < 2e-16 ***
poly(date, 2)1           2.11798    0.09598  22.066  < 2e-16 ***
poly(date, 2)2          -0.90577    0.09606  -9.429 8.01e-12 ***
weekdays(date)Monday     0.20610    0.05108   4.035 0.000233 ***
weekdays(date)Saturday  -0.23465    0.05101  -4.600 4.02e-05 ***
weekdays(date)Sunday    -0.26081    0.05104  -5.110 7.87e-06 ***
weekdays(date)Thursday   0.06649    0.04960   1.340 0.187464
weekdays(date)Tuesday    0.12698    0.05114   2.483 0.017221 *
weekdays(date)Wednesday  0.13979    0.05122   2.729 0.009307 **
---
Signif. codes:  0 ‘***’ 0.001 ‘**’ 0.01 ‘*’ 0.05 ‘.’ 0.1 ‘ ’ 1

Residual standard error: 0.09542 on 41 degrees of freedom
Multiple R-squared:  0.9496,	Adjusted R-squared:  0.9397
F-statistic: 96.52 on 8 and 41 DF,  p-value: < 2.2e-16
- resids.png (10.03 KiB) Viewed 2917 times
Re: COVID-19
Unfortunately there's a huge lag in that data:KAJ wrote: ↑Sun Nov 15, 2020 7:59 pmYes, concentrating on more recent data makes more recent changes clearer. I think my post of Thursday 7:08 pm (based on data.gov.uk) strongly suggested that cases had plateaued. This chart of todays data on deaths by date of death ...Deaths.pngjimbob wrote: ↑Sun Nov 15, 2020 5:03 pmI actually think that we're near or maybe over the peak as far as cases are concernedKAJ wrote: ↑Sun Nov 15, 2020 4:35 pmOh
Screenshot 2020-11-15 at 16.28.05.png
Or perhaps it's just the rain making me pessimistic.
<snip chart>
And that the rise in deaths might be starting to slow too. Still rising though.
<snip chart>
Again this is the ECDC by date reported, with centred 7-day averages in black so the date is the morning after the UK date (e.g. the 25th September was reported around 4pm on 24th on the UK COVID dashboard)
https://www.ecdc.europa.eu/en/publicati ... -worldwide
... strongly suggests deaths also have plateaued/are plateauing.
Have you considered stupidity as an explanation
Re: COVID-19
Just went on a Twitter surf off that tweet. Jesus f.cking Christ. There's no flu because it's all Covid. Half the Covid is false positive. It's just a "bad year" of flu. It's all a conspiracy (yeah, because Govts just love a lockdown, right?). I know soc media amplifies the crazy, but it's f.cking depressing and worrying when the press pick up on it uncritically.sTeamTraen wrote: ↑Sun Nov 15, 2020 5:49 pmSue Cook, former presenter of Crimewatch, has gone full frootloop.
There's definitely a conversation to be had about surviving lockdowns, about care of the elderly, about psychological and other impacts, and the Govt messaging and engagement has been and continues to be pisspoor, which fuels some of this stuff, but f.ck me the unwillingness to see some very simple cause and effect is lunacy.
-
Chris Preston
- Snowbonk
- Posts: 533
- Joined: Tue Nov 12, 2019 8:05 am
Re: COVID-19
After months of no cases of community transmission in South Australia, there are 17 cases confirmed in the past 2 days, 15 of them in one extended family. Original source was a returning overseas traveler who infected a worker at one of the quarantine hotels.
This demonstrates just how quickly numbers can grow from a single infected person. Even when an effective track and trace system is in place.
No doubt some complacency has set in in South Australia due to the long period of no community transmission and the relative freedom that has brought. If any new cases arise today, we can expect a tightening of restrictions.
Here grows much rhubarb.

Re: COVID-19
My suspicion is that the UK has:
- hotspot areas that were in tier 3, and to a lesser extent tier 2, where cases have fallen very successfully - more compliance, in place longer
- non hotspot areas that were tier 1 where cases are rising - poor compliance, not been locked down for long
My own area had grown from very low to what would be tier 2 over the last month.
It doesn't look like 2 more weeks of lockdown is anything like enough to get Covid knocked back. R=1 doesn't get us anywhere and there's no sign R is at 0.7 nationally.
 Awarded gold star 4 November 2021
Re: COVID-19
I don't think there is in the way you suggest. The data reported today comes from specimens taken one or more days earlier. For example, here's the head of today's data set as I've downloaded it:
- Screenshot 2020-11-15 at 21.41.07.png (28.3 KiB) Viewed 2845 times
There is a not-very-predictable delay between specimen date and reporting date, but that delay applies equally to both columns of data. Using PubCases ignores that delay, using SpecCases corrects for it.
The latest few days in SpecCases tend to have silly low values, many results from specimens taken on those days are not yet available. When results are available they appear in (different rows of) the SpecCases and PubCases columns at the same time. Because recent SpecCases are probably incomplete, I tend to exclude the latest 3 or 4 days from my analyses.
Associating any datum with the reporting date builds in and ignores the not-very-predictable delay between specimen date and reporting date, this is time-axis noise whose effect is very difficult to reduce. Associating the datum with specimen date means the delay is explicit in the missing data for recent days. As shown in my recent post this allows one to fit and study time effects with very simple models and little unfitted noise.
Re: COVID-19
Ah, we're talking about two different datasets.KAJ wrote: ↑Sun Nov 15, 2020 10:26 pmI don't think there is in the way you suggest. The data reported today comes from specimens taken one or more days earlier. For example, here's the head of today's data set as I've downloaded it:
Screenshot 2020-11-15 at 21.41.07.png
There were 24,962 cases reported today (PubCases) but none are shown for today under SpecCases (by specimen date). That doesn't mean those 24,962 cases are missing from SpecCases, they're just shown with the specimen date, not the date of publication. The missing values under SpecCases for the last few days will be filled in when those results become available, at the same time as they are reported. For a given date the numbers in PubCases will not change, the numbers in SpecCases will - but this reflects delays common to both columns but "hidden" in PubCases.
There is a not-very-predictable delay between specimen date and reporting date, but that delay applies equally to both columns of data. Using PubCases ignores that delay, using SpecCases corrects for it.
The latest few days in SpecCases tend to have silly low values, many results from specimens taken on those days are not yet available. When results are available they appear in (different rows of) the SpecCases and PubCases columns at the same time. Because recent SpecCases are probably incomplete, I tend to exclude the latest 3 or 4 days from my analyses.
Associating any datum with the reporting date builds in and ignores the not-very-predictable delay between specimen date and reporting date, this is time-axis noise whose effect is very difficult to reduce. Associating the datum with specimen date means the delay is explicit in the missing data for recent days. As shown in my recent post this allows one to fit and study time effects with very simple models and little unfitted noise.
I thought you were talking about deaths recorded by date of death, which does indeed have a lag - of over a week.
That isn't the case for deaths by date reported, which are obviously those reported between 4pm and 4pm that day and are fixed.
And obviously you are talking about cases.
So we're in agreement at least
Have you considered stupidity as an explanation
Re: COVID-19
That's my thinking too.lpm wrote: ↑Sun Nov 15, 2020 10:12 pmMy suspicion is that the UK has:
- hotspot areas that were in tier 3, and to a lesser extent tier 2, where cases have fallen very successfully - more compliance, in place longer
- non hotspot areas that were tier 1 where cases are rising - poor compliance, not been locked down for long
My own area had grown from very low to what would be tier 2 over the last month.
It doesn't look like 2 more weeks of lockdown is anything like enough to get Covid knocked back. R=1 doesn't get us anywhere and there's no sign R is at 0.7 nationally.
Have you considered stupidity as an explanation
Re: COVID-19
Cummins genuinely seems to believe his statements. Which is surprising.bob sterman wrote: ↑Sun Nov 15, 2020 7:05 pmShe appears to have fallen under the spell of Sikora, Heneghan and that diet guru bloke off Youtube...sTeamTraen wrote: ↑Sun Nov 15, 2020 5:49 pmSue Cook, former presenter of Crimewatch, has gone full frootloop.
Ex-BBC star Sue Cook, 71, accuses broadcaster of unbalanced Covid coverage and pushing too hard to shut down UK by forever 'wheeling out' 'Professor Lockdown' Neil Ferguson over other scientists
https://www.dailymail.co.uk/news/articl ... erage.html
The diet guru bloke (Cummins) is described as "Chief Program Officer for Irish Heart Disease Awareness" - which sounds very impressive. Except Irish Heart Disease Awareness has the same address as the one Cummins sells his diet guru books from.
He also was saying that we need to wait for the end of the year to see if this half year is just going to be like a bad flu. I pointed out that in Europe, you'd need 20,000 negative excess deaths up to Christmas in order to get to the second worst year on the Euromono dataset. It's currently over 50000 and rising. And indeed accelerating.
Have you considered stupidity as an explanation
Re: COVID-19
I'm afraid not. I was not clear that although I said "cases" the same argument applied mutatis mutandis to deaths. gov.uk says (my emphasis):jimbob wrote: ↑Sun Nov 15, 2020 10:36 pm
Ah, we're talking about two different datasets.
I thought you were talking about deaths recorded by date of death, which does indeed have a lag - of over a week.
That isn't the case for deaths by date reported, which are obviously those reported between 4pm and 4pm that day and are fixed.
And obviously you are talking about cases.

So we're in agreement at least
There are delays between deaths occurring and their being published in the gov.uk data set. Those delays are not-very-predictable and, as you've noticed, can be quite considerable. To associate deaths with date of publication builds this time-axis noise in and ignores it. Analysing with respect to date of death makes obvious that data for very recent dates is incomplete, but this is how it is.Total number of people who had a positive test result for COVID-19 and died within 28 days of the first positive test, reported on or up to the date of death or reporting date (depending on availability).
People who died more than 28 days after their first positive test are not included, whether or not COVID-19 was the cause of death.
Death data can be presented by when death occurred (date of death) or when the death was reported (date reported) and the availability of each of these time series varies by area:
- Deaths by date of death - each death is assigned to the date that the person died irrespective of how long it took for the death to be reported. Previously reported data are therefore continually updated
- Deaths by date reported - each death is assigned to the date when it was first included in the published totals.
Compare the charts of deaths by date of death and by date of publication:
- Screenshot 2020-11-15 at 23.12.09.png (16.39 KiB) Viewed 2810 times
- chart.png (5.44 KiB) Viewed 2810 times
Re: COVID-19
@jamesannan has R=1 now. He has been on the money so far? But yes, can't see restrictions being lifted for 3rd Dec.jimbob wrote: ↑Sun Nov 15, 2020 10:38 pmThat's my thinking too.lpm wrote: ↑Sun Nov 15, 2020 10:12 pmMy suspicion is that the UK has:
- hotspot areas that were in tier 3, and to a lesser extent tier 2, where cases have fallen very successfully - more compliance, in place longer
- non hotspot areas that were tier 1 where cases are rising - poor compliance, not been locked down for long
My own area had grown from very low to what would be tier 2 over the last month.
It doesn't look like 2 more weeks of lockdown is anything like enough to get Covid knocked back. R=1 doesn't get us anywhere and there's no sign R is at 0.7 nationally.
Re: COVID-19
Yes, and you can do a 7day average on the reported date and smooth out most of the noise - yes the maximum lag might be longer than a week, but the biggest variation is in day of the week.KAJ wrote: ↑Sun Nov 15, 2020 11:18 pmI'm afraid not. I was not clear that although I said "cases" the same argument applied mutatis mutandis to deaths. gov.uk says (my emphasis):jimbob wrote: ↑Sun Nov 15, 2020 10:36 pm
Ah, we're talking about two different datasets.
I thought you were talking about deaths recorded by date of death, which does indeed have a lag - of over a week.
That isn't the case for deaths by date reported, which are obviously those reported between 4pm and 4pm that day and are fixed.
And obviously you are talking about cases.
So we're in agreement at leastThere are delays between deaths occurring and their being published in the gov.uk data set. Those delays are not-very-predictable and, as you've noticed, can be quite considerable. To associate deaths with date of publication builds this time-axis noise in and ignores it. Analysing with respect to date of death makes obvious that data for very recent dates is incomplete, but this is how it is.Total number of people who had a positive test result for COVID-19 and died within 28 days of the first positive test, reported on or up to the date of death or reporting date (depending on availability).
People who died more than 28 days after their first positive test are not included, whether or not COVID-19 was the cause of death.
Death data can be presented by when death occurred (date of death) or when the death was reported (date reported) and the availability of each of these time series varies by area:
- Deaths by date of death - each death is assigned to the date that the person died irrespective of how long it took for the death to be reported. Previously reported data are therefore continually updated
- Deaths by date reported - each death is assigned to the date when it was first included in the published totals.
Compare the charts of deaths by date of death and by date of publication:
Screenshot 2020-11-15 at 23.12.09.png
See how using publication date introduces a substantial weekday effect almost absent from the by date of death graph. That size of real weekday effect on deaths just isn't credible - it's caused by reporting delays. For cases, on the other hand, the weekday effect reflects real variations in testing numbers.
chart.png
Unsurprisingly, when you do that, you see that when rising, the reported date lags the actual date equivalent rolling average
Have you considered stupidity as an explanation
Re: COVID-19
jimbob wrote: ↑Sun Nov 15, 2020 11:34 pmYes, and you can do a 7day average on the reported date and smooth out most of the noise - yes the maximum lag might be longer than a week, but the biggest variation is in day of the week.KAJ wrote: ↑Sun Nov 15, 2020 11:18 pmI'm afraid not. I was not clear that although I said "cases" the same argument applied mutatis mutandis to deaths. gov.uk says (my emphasis):jimbob wrote: ↑Sun Nov 15, 2020 10:36 pm
Ah, we're talking about two different datasets.
I thought you were talking about deaths recorded by date of death, which does indeed have a lag - of over a week.
That isn't the case for deaths by date reported, which are obviously those reported between 4pm and 4pm that day and are fixed.
And obviously you are talking about cases.
So we're in agreement at leastThere are delays between deaths occurring and their being published in the gov.uk data set. Those delays are not-very-predictable and, as you've noticed, can be quite considerable. To associate deaths with date of publication builds this time-axis noise in and ignores it. Analysing with respect to date of death makes obvious that data for very recent dates is incomplete, but this is how it is.Total number of people who had a positive test result for COVID-19 and died within 28 days of the first positive test, reported on or up to the date of death or reporting date (depending on availability).
People who died more than 28 days after their first positive test are not included, whether or not COVID-19 was the cause of death.
Death data can be presented by when death occurred (date of death) or when the death was reported (date reported) and the availability of each of these time series varies by area:
- Deaths by date of death - each death is assigned to the date that the person died irrespective of how long it took for the death to be reported. Previously reported data are therefore continually updated
- Deaths by date reported - each death is assigned to the date when it was first included in the published totals.
Compare the charts of deaths by date of death and by date of publication:
Screenshot 2020-11-15 at 23.12.09.png
See how using publication date introduces a substantial weekday effect almost absent from the by date of death graph. That size of real weekday effect on deaths just isn't credible - it's caused by reporting delays. For cases, on the other hand, the weekday effect reflects real variations in testing numbers.
chart.png
Unsurprisingly, when you do that, you see that when rising, the reported date lags the actual date equivalent rolling average
- Screenshot 2020-11-16 073234.png (52.43 KiB) Viewed 2772 times
Have you considered stupidity as an explanation
Re: COVID-19
Though of course, I guess looking at the variation, it would make more sense for it to be a geometric mean rather than a straight average. But I suspect it won't change the story much.
As I'm not discussing this in public with disingenuous fools, I can put it back into a log scale
As I'm not discussing this in public with disingenuous fools, I can put it back into a log scale
- Screenshot 2020-11-16 081237.png (68.26 KiB) Viewed 2762 times
Have you considered stupidity as an explanation
Re: COVID-19
But after distorting the data by associating with the wrong (for almost all purposes) date, that introduces a further, artificial, distortion. It may look better, but it's still wrong!jimbob wrote: ↑Sun Nov 15, 2020 11:34 pmYes, and you can do a 7day average on the reported date and smooth out most of the noise - yes the maximum lag might be longer than a week, but the biggest variation is in day of the week.
Unsurprisingly, when you do that, you see that when rising, the reported date lags the actual date equivalent rolling average
The blunt fact is that (at 5:00 p.m. 15 Nov) we don't know how many cases (or deaths, admissions, inpatients) there were on 15th, 14th, 13th November. Our information for a few days earlier is suspect. Plotting earlier cases (or deaths) on those dates doesn't really help at all, it is very likely to mislead others and perhaps even ourselves. The only honest way of plotting data for 15th, 14th, 13th is to wait until that data is available.