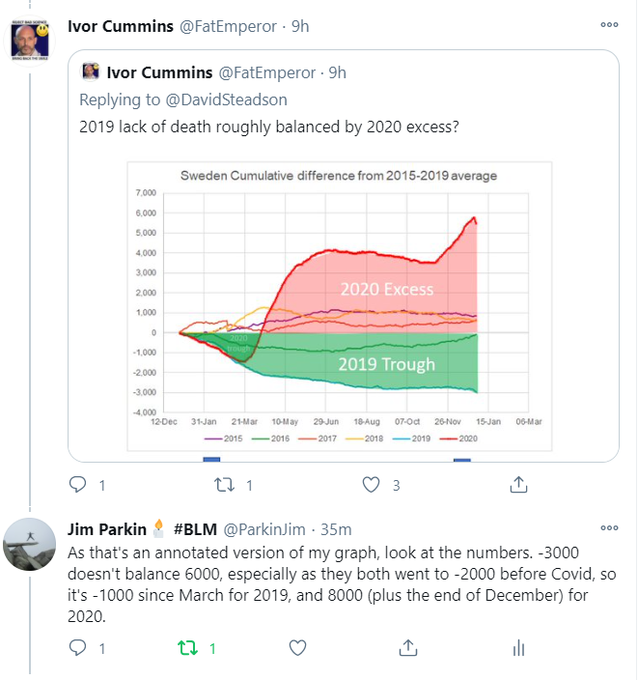
The area under the curve could be interpreted as something like "number of person-days lost" as compared to the baseline.jimbob wrote: Sun Jan 17, 2021 1:17 am Ivor Cummins seems to like my graph. But he's even more of an innumerate idiot than I thought
https://twitter.com/FatEmperor/status/1 ... 75136?s=20
But
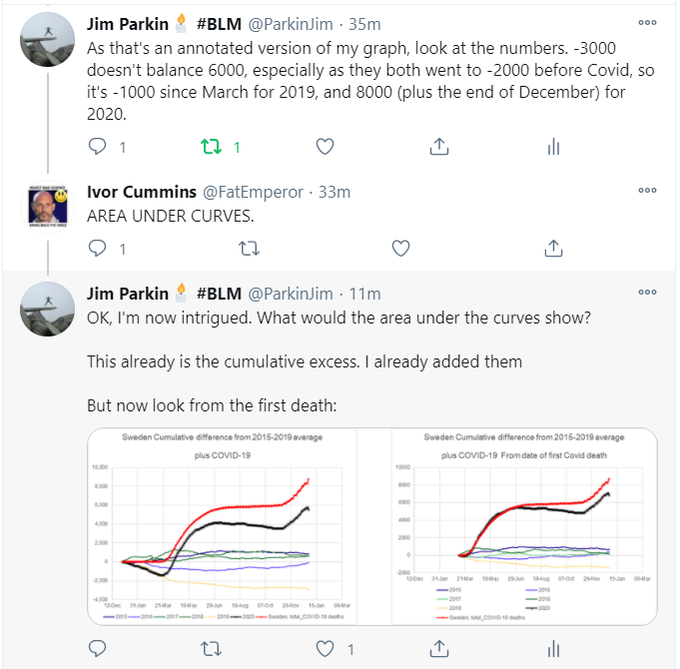
- Sweden-total-deaths.png (96.71 KiB) Viewed 5571 times
The issue is that by subtracting the baseline "number of deaths which would normally have happened by that day" in your graph you've made it seem like you can treat it like the deaths-per-day graph, and integrate it to get the total deaths, which you can't because that's not what it is.