Thanks! Pick awayKAJ wrote: ↑Sun Feb 21, 2021 7:45 pmJust a couple of nit-picks. Please don't be offended.Bird on a Fire wrote: ↑Sun Feb 21, 2021 7:03 pmThought I'd have a play with some trajectories to look at the size of expected variations.
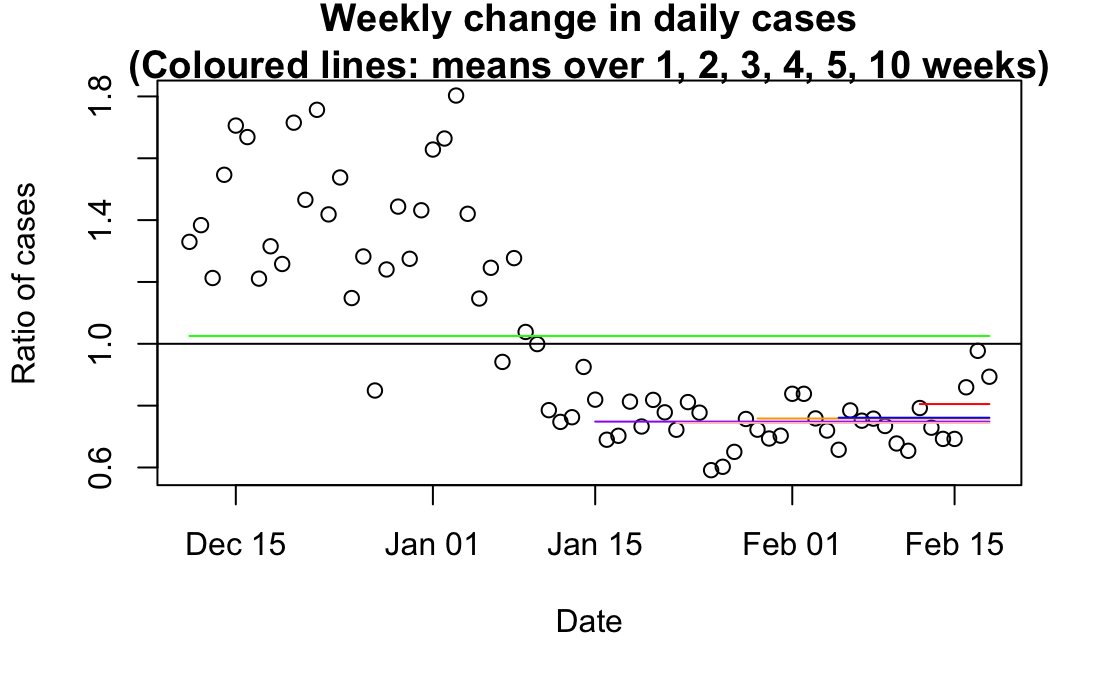
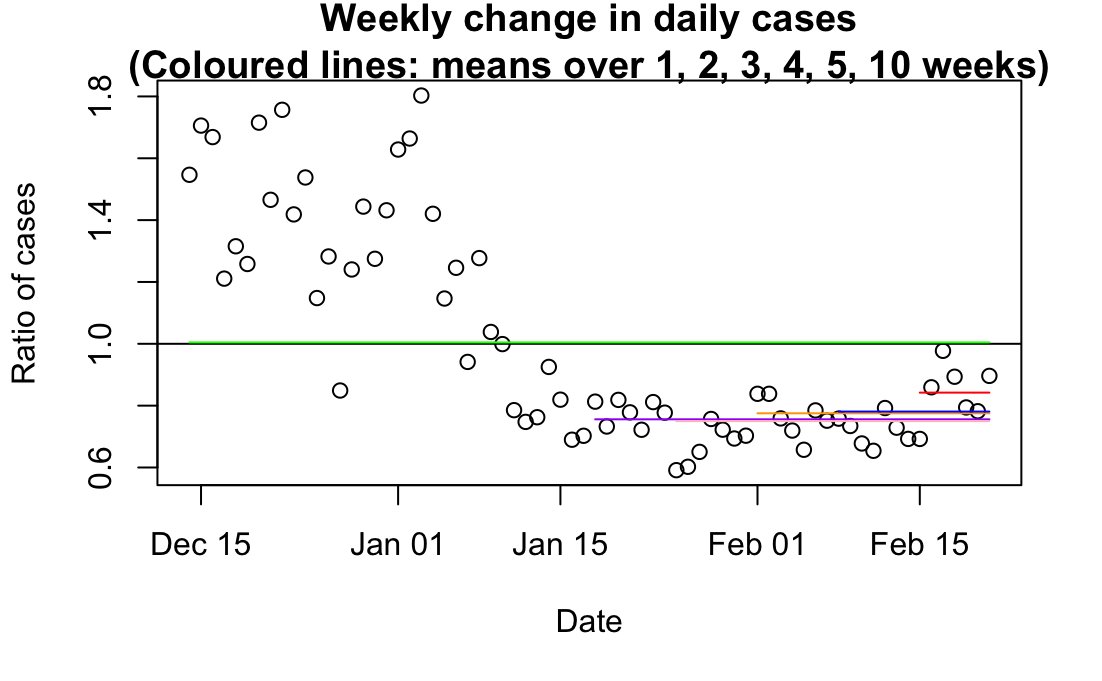
This is a super-simple individual-based model. Each infected individual infects n others, where n is drawn from a Poisson distribution with lambda (ie, mean and s.d.) equal to some reproduction number (so assuming a constant halving time). So with R<1, most individuals infect nobody, but some infect 1 or even 2 or 3 etc. This gives a mean that follows an exponential curve, but with stochastic variation around it.
Summing those new infections in each time step gives the total infected population, which then feeds forward to the next time step. A pretty bog standard Markov chain population model, in fact. I've done 1000 reps of each scenario just to get a look.
"...Poisson distribution with lambda (ie, mean and s.d.)..." should be "mean and variance".
"...reps of each scenario..." In this context time is on an interval scale (Wiki) so the origin is arbitrary. That means the later scenarios (N0 = 10000, 1000, etc.) are just later evolutions of one outcome (the mean) of the first scenario (N0 = 30000). Effectively you've zoomed in on different regions of the tail.
I do see what you mean about each plot basically showing different regions of the same process, which is fair enough. Though I quite like the demonstration that you can get this fairly large spread of trajectories in 12 steps, starting from exactly the same point - if I ran these Markov chains for dozens of steps the error would compound going forward, as in the plot in my post above). (Other than that I was just recycling variable names in my code)
I suppose to simulate test data better, we'd want to consider each time step as a single day, and nudge Rt up accordingly.
(The lambda thing was a total brain fart.)