COVID-19
-
Bird on a Fire

- Princess POW
- Posts: 10142
- Joined: Fri Oct 11, 2019 5:05 pm
- Location: Portugal
Re: COVID-19
I wonder if PHE have checked their spreadsheet recently.
We have the right to a clean, healthy, sustainable environment.
-
El Pollo Diablo

- Stummy Beige
- Posts: 3577
- Joined: Wed Sep 25, 2019 4:41 pm
- Location: FBPE
Re: COVID-19
Hope people are enjoying Cummings' evidence.
If truth is many-sided, mendacity is many-tongued
Re: COVID-19
The default theme in R/ggplot2 puts minor gridlines uniformly spaced between the major ones, however the scale is transformed. It's not much more of a fiddle to remove them, see, for instance here: https://felixfan.github.io/ggplot2-remo ... nd-margin/.KAJ wrote: ↑Tue May 25, 2021 9:45 pmBecause that's how ggplot2 did it (i.e. I don't know!).
As indicated above, the plot used only 3 ggplot2 functions.Code: Select all
ggplot(subset(UKDF, date > as.Date("2021-04-12")), aes(x = date, y = MVBeds)) + geom_point() + logyAll those functions have many available arguments, most of which I left at the defaults.
- ggplot() specified the data as a subset of the dataframe UKDF, and default x and y variables
- geom_point() added symbols
- I had earlier defined logy <- scale_y_continuous(trans='log10'). Reviewing the help, I could have used the slightly simpler but equivalent logy <- scale_y_log10(). I'll probably change my code to use that.
scale_y_continuous() has an argument `breaks` which I could have specified but left at the default breaks = waiver() which uses "the default breaks computed by the transformation object". If you're really interested () the relevant code may be at https://github.com/r-lib/scales/blob/master/R/breaks-log.R
If they were labelled (they wouldn't be minor gridlines) then you'd see they are equally spaced in log space rather than in linear space.
-
wilsontown

- Clardic Fug
- Posts: 216
- Joined: Tue Feb 23, 2021 11:51 am
Re: COVID-19
I suppose at one level it's not all that surprising that hospital numbers would start to level out. The 7 day case average fell to a low of ~2020 on May 2nd and has risen fairly steadily ever since. It is now ~2608. In general the most vulnerable are vaccinated (and more are vaccinated every day) but we're still going to see some people end up in hospital.
"All models are wrong but some are useful" - George Box

Re: COVID-19
Cummings is confirming what most of us agreed in March 2020 - that the govt was intending to recklessly and deliberately run Covid hot to diminish future waves.
Looking back, most of us were saying identical things. For example on 14 March 2020 I said the govt policy was:
On 16 March I said:Flatten at a higher level, hoping for huge numbers of non-vulnerable people to catch it, recover and be immune.
The plan is absolutely and almost explicitly stating that the daily infection rate is to be higher than other EU countries. The fundamental idea is the belief they will be low now, then uncontrolled very high later on this year; the UK will be a constant high throughout the year.
You can't defend the UK plan without implying the WHO and nearly all other EU countries are wrong.
Again on 16 March I compared it to running a nuclear reactor hotter:Herd immunity was such a terrible thing to say. Will live on in infamy, in every history text book.
Almost everyone was saying very similar things. There was an interim few days before the official lockdown announcement when the voluntary lockdown was happening - people removing kids from school, staying at home, crowding out the supermarkets. This was the period 10 March to the official announcement on 23 March. On this forum we were remarkably 100% clear during these few days that the govt was deliberately planning to keep running hot.The govt deliberately decided to run the reactor hotter, to churn out more neutrons early on. Ramp up fast, shove in control rods later than they could have done. The hope is more of the fuel is exhausted by the time the control rods degrade later in the year.
Proof?
- on Thursday ill people were only told to isolate for 7 days, when probably infectious for at least 14
- on Thursday the partners and housemates of ill people did not need to isolate, were free to leave the house and take a packed underground train
Their model now tells them it's time to put in some control rods, but not all. They are not lowering the schools control rod yet. They want the reactor to run a little hotter still.
It's a hell of approach. Part of the reason why they are communicating badly is because they don't dare communicate clearly.
There were a handful of comments implying we should trust the govt and their scientific advisors, and hints that we plebs weren't understanding nuances in the situation, but those were very rare. We were probably helped by having shpalman's reports from Italy and, unlike the govt, we were aware we were 2 weeks not 4 weeks behind Italy.
We were incredibly pessimistic during these days because we were forecasting exactly what Cummings has outlined - a mad government without a plan and pursuing a policy of getting the masses to immunity via infection. What Cummings is now describing was easily visible from the outside.
 Awarded gold star 4 November 2021
-
El Pollo Diablo
- Stummy Beige
- Posts: 3577
- Joined: Wed Sep 25, 2019 4:41 pm
- Location: FBPE
Re: COVID-19
I'm still absolutely in shock at that two weeks/four weeks thing. I'm fairly far away from being an epidemiologist but I can draw charts with trendlines and logarithmic axes and it was just so clear it was two weeks, I'm amazed that SAGE were so wrong on it.
If truth is many-sided, mendacity is many-tongued

Re: COVID-19
Exactly, and *we* were using confirmed deaths, because we knew that case numbers were unreliable. Which really is not rocket science.El Pollo Diablo wrote: ↑Wed May 26, 2021 12:54 pmI'm still absolutely in shock at that two weeks/four weeks thing. I'm fairly far away from being an epidemiologist but I can draw charts with trendlines and logarithmic axes and it was just so clear it was two weeks, I'm amazed that SAGE were so wrong on it.
Dad and his former colleagues all learned that if you wait for certainty, in a fast-growing disease outbreak, you will be certain to be too late for many decisions
Have you considered stupidity as an explanation
-
El Pollo Diablo
- Stummy Beige
- Posts: 3577
- Joined: Wed Sep 25, 2019 4:41 pm
- Location: FBPE
Re: COVID-19
Nope, but he and his college friends all started working for MAFF just before the 1967 Foot and Mouth outbreak. Which was stressful - the only time anyone (a farmer) pulled a gun (shotgun) on him (and the local copper).
They also realised that F&M was airborne as opposed to an animal vector (which was the scientific thinking at the time) due to the infected farms following the prevailing wind.
Have you considered stupidity as an explanation
Re: COVID-19
And we saw the same tardy response in the 2000-2001 F&M outbreak. Ignoring lessons learned from animal disease outbreaks 20 years ago seems stupid.jimbob wrote: ↑Wed May 26, 2021 2:44 pmNope, but he and his college friends all started working for MAFF just before the 1967 Foot and Mouth outbreak. Which was stressful - the only time anyone (a farmer) pulled a gun (shotgun) on him (and the local copper).
They also realised that F&M was airborne as opposed to an animal vector (which was the scientific thinking at the time) due to the infected farms following the prevailing wind.
Have you considered stupidity as an explanation
Re: COVID-19
I don't think base_breaks() is in any of the tidyverse packages. You can't add the break at 100 (which lpm seemed to want) without extending the scale that low, and extending the scale automagically adds the break.Bird on a Fire wrote: ↑Wed May 26, 2021 9:17 amYou can use breaks=base_breaks() to get labels at 1, 10, 100 etc, which will put a label close to the current values (which are all close to 100), which might be more similar to other log plots the folk complaining have seen.KAJ wrote: ↑Tue May 25, 2021 9:45 pm
All those functions have many available arguments, most of which I left at the defaults.
scale_y_continuous() has an argument `breaks` which I could have specified but left at the default breaks = waiver() which uses "the default breaks computed by the transformation object".
<snip>
Code: Select all
ggplot(subset(UKDF, date > as.Date("2021-04-12")), aes(x = date, y = MVBeds)) + geom_point() + scale_y_log10(limits = c(100,NA))- MVBeds.png (7.09 KiB) Viewed 4015 times
-
Bird on a Fire
- Princess POW
- Posts: 10142
- Joined: Fri Oct 11, 2019 5:05 pm
- Location: Portugal
Re: COVID-19
You're right - turns out I'd defined it elsewhere, with a comment saying I got it from here https://stackoverflow.com/questions/142 ... not-manualKAJ wrote: ↑Wed May 26, 2021 4:27 pmI don't think base_breaks() is in any of the tidyverse packages. You can't add the break at 100 (which lpm seemed to want) without extending the scale that low, and extending the scale automagically adds the break.Bird on a Fire wrote: ↑Wed May 26, 2021 9:17 amYou can use breaks=base_breaks() to get labels at 1, 10, 100 etc, which will put a label close to the current values (which are all close to 100), which might be more similar to other log plots the folk complaining have seen.KAJ wrote: ↑Tue May 25, 2021 9:45 pm
All those functions have many available arguments, most of which I left at the defaults.
scale_y_continuous() has an argument `breaks` which I could have specified but left at the default breaks = waiver() which uses "the default breaks computed by the transformation object".
<snip>MVBeds.pngCode: Select all
ggplot(subset(UKDF, date > as.Date("2021-04-12")), aes(x = date, y = MVBeds)) + geom_point() + scale_y_log10(limits = c(100,NA))
Quite like your solution too, although personally I do agree that those equidistant minor ticks are a bit confusing.
You're right about that as well.
lpm used to be all in favour of quick-and-dirty early-warning-systems. I'm not sure why this one has caused controversy.
We have the right to a clean, healthy, sustainable environment.
Re: COVID-19
There's been talk of a "race" between the next wave of infections and the vaccination programme. I've been largely down-weighting the recent increase in cases on the basis that the vaccines protect against severe infection better than against infection. A much-above-zero stall in the decline in healthcare numbers, especially MVBeds, suggests that maybe the race is being lost. Here are the numbers from coronavirus.data.gov.uk for the last few weeks - to avoid being sidetracked I've not graphed them.wilsontown wrote: ↑Wed May 26, 2021 10:38 amI suppose at one level it's not all that surprising that hospital numbers would start to level out. The 7 day case average fell to a low of ~2020 on May 2nd and has risen fairly steadily ever since. It is now ~2608. In general the most vulnerable are vaccinated (and more are vaccinated every day) but we're still going to see some people end up in hospital.
Code: Select all
       date Admits InPats MVBeds
 2021-05-02    119   1282    196
 2021-05-03    123   1300    187
 2021-05-04    101   1293    181
 2021-05-05    117   1236    182
 2021-05-06    120   1157    163
 2021-05-07    102   1154    159
 2021-05-08    108   1135    151
 2021-05-09    102   1116    144
 2021-05-10    103   1127    149
 2021-05-11    105   1104    138
 2021-05-12    116   1065    136
 2021-05-13    102    998    129
 2021-05-14     94    973    124
 2021-05-15     90    963    121
 2021-05-16     78    938    123
 2021-05-17    101    940    125
 2021-05-18    124    895    124
 2021-05-19    124    915    122
 2021-05-20    130    909    123
 2021-05-21    117    918    124
 2021-05-22    115    882    123
 2021-05-23     NA    918    120
 2021-05-24     NA    954    121
2021-05-25 NA NA 128Re: COVID-19
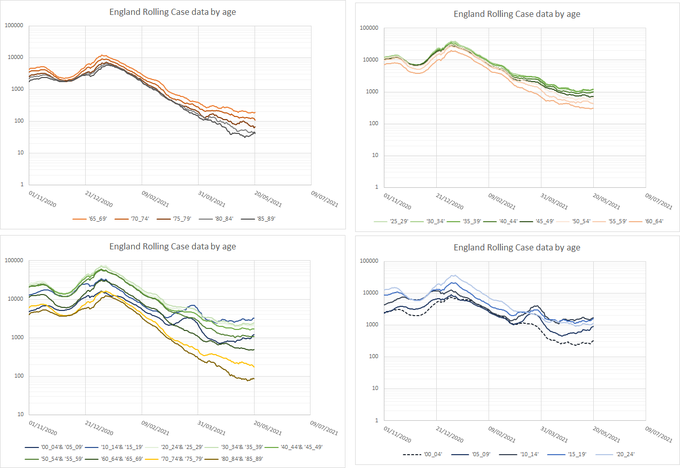
England cases by age grouped into demographics
Top left - mostly retired. Top right - mostly working age
Bottom left - age by decade. Bottom right - mostly in education
Top left - mostly retired. Top right - mostly working age
Bottom left - age by decade. Bottom right - mostly in education
Have you considered stupidity as an explanation
-
shpalman

- Princess POW
- Posts: 8428
- Joined: Mon Nov 11, 2019 12:53 pm
- Location: One step beyond
- Contact:
Re: COVID-19
A graph with a meaningless unquantified y-axis made it look like the UK's "flatten the curve in July" strategy would work, until Neil Ferguson quantified it by pointing out that the peak would be many many times higher than the UK's ICU capacity.Bird on a Fire wrote: ↑Wed May 26, 2021 5:30 pmYou're right - turns out I'd defined it elsewhere, with a comment saying I got it from here https://stackoverflow.com/questions/142 ... not-manualKAJ wrote: ↑Wed May 26, 2021 4:27 pmI don't think base_breaks() is in any of the tidyverse packages. You can't add the break at 100 (which lpm seemed to want) without extending the scale that low, and extending the scale automagically adds the break.Bird on a Fire wrote: ↑Wed May 26, 2021 9:17 am
You can use breaks=base_breaks() to get labels at 1, 10, 100 etc, which will put a label close to the current values (which are all close to 100), which might be more similar to other log plots the folk complaining have seen.
<snip>MVBeds.pngCode: Select all
ggplot(subset(UKDF, date > as.Date("2021-04-12")), aes(x = date, y = MVBeds)) + geom_point() + scale_y_log10(limits = c(100,NA))
Quite like your solution too, although personally I do agree that those equidistant minor ticks are a bit confusing.
You're right about that as well.
lpm used to be all in favour of quick-and-dirty early-warning-systems. I'm not sure why this one has caused controversy.
So yeah the numbers matter.
having that swing is a necessary but not sufficient condition for it meaning a thing
@shpalman@mastodon.me.uk
@shpalman@mastodon.me.uk
Re: COVID-19
I'll point out that my original graph did have a quantified y-axis, albeit only two labels, and the post included a link to the data.shpalman wrote: ↑Thu May 27, 2021 6:12 amA graph with a meaningless unquantified y-axis made it look like the UK's "flatten the curve in July" strategy would work, until Neil Ferguson quantified it by pointing out that the peak would be many many times higher than the UK's ICU capacity.Bird on a Fire wrote: ↑Wed May 26, 2021 5:30 pmYou're right - turns out I'd defined it elsewhere, with a comment saying I got it from here https://stackoverflow.com/questions/142 ... not-manualKAJ wrote: ↑Wed May 26, 2021 4:27 pm
I don't think base_breaks() is in any of the tidyverse packages. You can't add the break at 100 (which lpm seemed to want) without extending the scale that low, and extending the scale automagically adds the break.MVBeds.pngCode: Select all
ggplot(subset(UKDF, date > as.Date("2021-04-12")), aes(x = date, y = MVBeds)) + geom_point() + scale_y_log10(limits = c(100,NA))
Quite like your solution too, although personally I do agree that those equidistant minor ticks are a bit confusing.
You're right about that as well.
lpm used to be all in favour of quick-and-dirty early-warning-systems. I'm not sure why this one has caused controversy.
So yeah the numbers matter.
-
Bird on a Fire
- Princess POW
- Posts: 10142
- Joined: Fri Oct 11, 2019 5:05 pm
- Location: Portugal
Re: COVID-19
Plus, the claim was just that the decline had stopped, not that it had stopped at a meaningful value.
You absolutely could verify that from a plot with a "meaningless unquantified y-axis" had one been presented.
But yeah, bit of a fail from ggplot2's default log axis labelling settings there I think. On the first plot I just assumed that major ticks were going in 100s, so you could see that the plateau was at a value over 100, but subsequent plots suggest that's not actually the case.
Somebody tweet Hadley Wickham a link to this thread
We have the right to a clean, healthy, sustainable environment.
Re: COVID-19
My response to lpm's criticism made clear that the plateau was indeed at a value over 100 (emphasis added).Bird on a Fire wrote: ↑Thu May 27, 2021 12:44 pmPlus, the claim was just that the decline had stopped, not that it had stopped at a meaningful value.
You absolutely could verify that from a plot with a "meaningless unquantified y-axis" had one been presented.
But yeah, bit of a fail from ggplot2's default log axis labelling settings there I think. On the first plot I just assumed that major ticks were going in 100s, so you could see that the plateau was at a value over 100, but subsequent plots suggest that's not actually the case.
Somebody tweet Hadley Wickham a link to this thread
KAJ wrote: ↑Tue May 25, 2021 7:24 pmDisagree.lpm wrote: ↑Tue May 25, 2021 5:53 pmThat's a naughty little chart.
Log scale and a short x-axis hide the fact that it's down from 4,000 to 100. While hospital patients are down from 80,000 to 1,000.
It's inevitable that the date will bounce around when a lot levels, while appearing very smooth at high levels. If a wave starts building there won't be anything to see for a couple of weeks due to the lags.
<snip>
The recent data doesn't "bounce around", here are the last 20 reported values in order:My point is that, after a sustained decline, these are remarkably constant - the last 11 are all between 120 and 125Code: Select all
182 163 159 151 144 149 138 136 129 124 121 123 125 124 122 123 124 123 120 121
<snip>
-
shpalman
- Princess POW
- Posts: 8428
- Joined: Mon Nov 11, 2019 12:53 pm
- Location: One step beyond
- Contact:
Re: COVID-19
Linear scale and log scale. The log scale doesn't make much difference since the variation is only about half an order of magnitude except that it makes the transition from decay to plateau look more sudden.
Obviously I can't make the log plot start at zero, but if I were to make it start at 1 then it wouldn't be particularly useful except for extrapolating how long it would have taken to decay to the last patient in the ICU.
- mec-vent-UK-data_2021-May-26_lin.jpg (54.46 KiB) Viewed 3833 times
- mec-vent-UK-data_2021-May-26.jpg (53.47 KiB) Viewed 3833 times
having that swing is a necessary but not sufficient condition for it meaning a thing
@shpalman@mastodon.me.uk
@shpalman@mastodon.me.uk
-
Bird on a Fire
- Princess POW
- Posts: 10142
- Joined: Fri Oct 11, 2019 5:05 pm
- Location: Portugal
Re: COVID-19
The nice thing with the log plot is it shows a change from exponential decline to plateau quite clearly (though you can eyeball it from the linear plot).
And yes KAJ did provide the raw data immediately and interpret the graph for those that didn't get it.
And yes KAJ did provide the raw data immediately and interpret the graph for those that didn't get it.
We have the right to a clean, healthy, sustainable environment.
Re: COVID-19
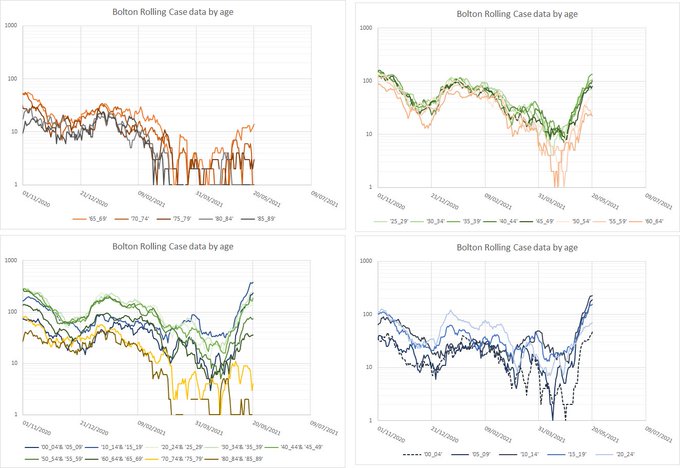
What we need is England excluding all towns beginning with B, and the towns beginning with B separately.
Nearly all the country has weeks before it needs to worry about intensive care beds and hospital admissions. A few places will be seeing worrying rises now. The vaccine seems to work just fine against 167-variant hospitalisation so it remains a pretty desperate race to keep ahead.
Nearly all the country has weeks before it needs to worry about intensive care beds and hospital admissions. A few places will be seeing worrying rises now. The vaccine seems to work just fine against 167-variant hospitalisation so it remains a pretty desperate race to keep ahead.
Awarded gold star 4 November 2021
Re: COVID-19
What about Formby?lpm wrote: ↑Thu May 27, 2021 1:56 pmWhat we need is England excluding all towns beginning with B, and the towns beginning with B separately.
Nearly all the country has weeks before it needs to worry about intensive care beds and hospital admissions. A few places will be seeing worrying rises now. The vaccine seems to work just fine against 167-variant hospitalisation so it remains a pretty desperate race to keep ahead.
where once I used to scintillate
now I sin till ten past three
now I sin till ten past three
Re: COVID-19
Just to close (?) the log scales issue, I think Hadley Wickham is aware of the issue! In ggplot2 I found annotation_logticks() which puts minor breaks at the more familiar spacing turning, for example, thisBird on a Fire wrote: ↑Thu May 27, 2021 12:44 pm<snip>
But yeah, bit of a fail from ggplot2's default log axis labelling settings there I think. On the first plot I just assumed that major ticks were going in 100s, so you could see that the plateau was at a value over 100, but subsequent plots suggest that's not actually the case.
Somebody tweet Hadley Wickham a link to this thread
Code: Select all
aDF <- data.frame(x=seq(0,3,0.2), y=10^seq(0,3,0.2))
ggplot(aDF, aes(x = x, y = y)) + geom_point() + scale_y_log10()- plain.png (4.47 KiB) Viewed 3829 times
Code: Select all
ggplot(aDF, aes(x = x, y = y)) + geom_point() + scale_y_log10() + annotation_logticks(sides = "l")- logticks.png (5.01 KiB) Viewed 3829 times
-
Bird on a Fire
- Princess POW
- Posts: 10142
- Joined: Fri Oct 11, 2019 5:05 pm
- Location: Portugal
Re: COVID-19
That's very handy - thanks for the tip! Always more to learn 
We have the right to a clean, healthy, sustainable environment.