Re: COVID-19
Posted: Mon Oct 18, 2021 5:39 pm
This is all qualitative and anecdotal. We must stick to hard data to make rational decisions.
Serious question - I notice you weren't involved in discussions in the "Pandemic Arena" part of the forum until about a month ago.sheldrake wrote: Mon Oct 18, 2021 5:39 pm This is all qualitative and anecdotal. We must stick to hard data to make rational decisions.
edited:-bob sterman wrote: Mon Oct 18, 2021 5:45 pm
Serious question - I notice you weren't involved in discussions in the "Pandemic Arena" part of the forum until about a month ago.
What suddenly got you interested in this idea that COVID-19 hasn't caused substantial excess mortality? If it was a particularly persuasive article on this issue - please do share it.
People often said that about brexit and other topics, and when I looked back I found some perspectives (and evidence) hadn't really been surfaced, or had been dismissed in an emotive way due to groupthink. If you feel something I'm raising has definitely already been covered by a specific post, please link me to it.Of course you could have been reading all the "Pandemic Arena" discussions for the past 18 months or so. But right now we seem to be rehashing discussions that were had on many previous occasions.
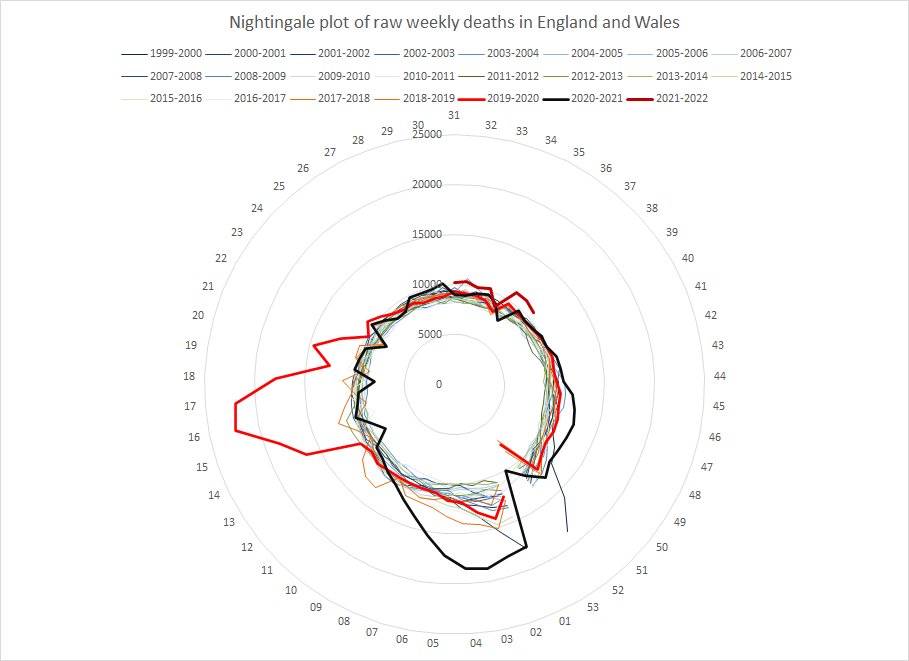
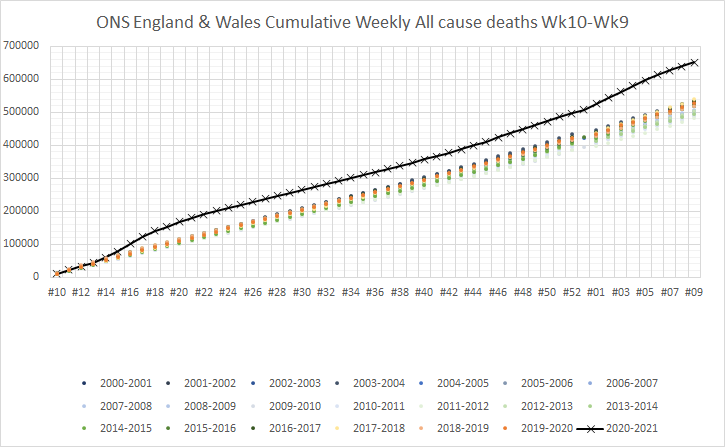
1) Raw weekly all cause deaths in England and Wales - historic data from figure 4 of https://www.ons.gov.uk/peoplepopulation ... o2016finalsheldrake wrote: Mon Oct 18, 2021 4:44 pmI'd love to understand this plot more deeply. I have some questions about itjimbob wrote: Mon Oct 18, 2021 1:31 pm
No but I have data for all cause deaths for England and Wales going back to wk31 1999 showing how it was completely abnormal to then.
1) Is it showing all deaths, or all hospital deaths?
2) Is the bulge for week 18 of 2019-20 April/May of 2019. or does it represent some other date
Thank you.jimbob wrote: Mon Oct 18, 2021 6:17 pm
1) Raw weekly all cause deaths in England and Wales - historic data from figure 4 of https://www.ons.gov.uk/peoplepopulation ... o2016final
2015 data onwards from the ONS weekly all cause deaths reports. There were not (Looks at the radius of the circle and the scale) around 520,000 deaths (roughly 10,000 per week x 52) in hospitals in England and Wales.
Thanks, it wasn't obvious to me that the later weeks of something labelled 2019-2020 would actually correspond to 2019. It's also not clear to me that this would be the case because our age-adjusted mortality in 2020 was lower than 2009 and every year back to 1990.2) It is implicit in the graph. It runs from wk31-wk30 so 2019-2020 would have wks 31-52 as 2019, and wks 01-30 as 2020.
Also it's pretty obvious that the only time this century when there were more than twice the usual weekly deaths was not in April 2019.
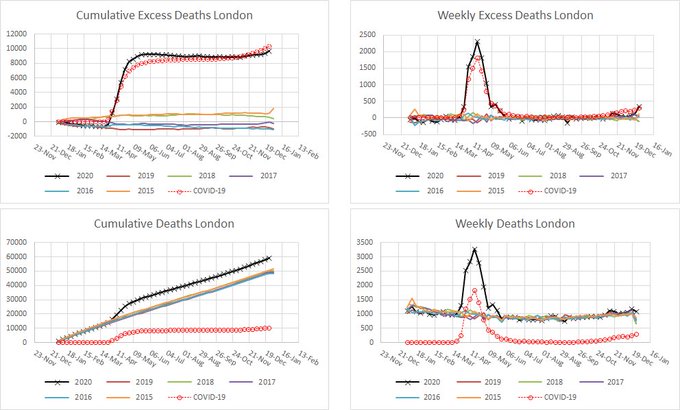
1) yes you can. When you dig into the numbers. Which it's perfectly possible for you to do. I'm using London as that's the first of my graphs that I found.sheldrake wrote: Wed Oct 13, 2021 10:33 pm
1) 'Excess deaths' depend on what you take as a 'normal' level of deaths. Previous 5 years we had unusually low age-adjusted mortality compared to the norms going back to 1990. You can't assume that all, or even most, deaths above the previous 5-year average were really the result of untested Covid.
2) Deaths that occur even when somebody tests positive to Covid aren't necessarily primarily caused by Covid. I think the cause of admission to hospital (e.g. admitted for Covid, or unknown respiratory) would be the best thing to look at, don't know if it's possible to dig that out.
The thing about age-adjusted mortality is that it's a read herring. For the last 20 years, the fall in that has been pretty much offset by the rise in the population, so the weekly number of deaths has been remarkably constant.sheldrake wrote: Mon Oct 18, 2021 6:20 pm
Thanks, it wasn't obvious to me that the later weeks of something labelled 2019-2020 would actually correspond to 2019. It's also not clear to me that this would be the case because our age-adjusted mortality in 2020 was lower than 2009 and every year back to 1990.
But again, you've posted a comparison that doesn't look back far enough. How does 2003 look, for example?jimbob wrote: Mon Oct 18, 2021 6:35 pm
1) yes you can. When you dig into the numbers. Which it's perfectly possible for you to do. I'm using London as that's the first of my graphs that I found.
After the weekend it usually takes a day or two for the hospital admissions and occupancy figures to get caught up, and after last weekend also I will need a day or two, then we can see if things are trending up or down (although for sure hospital figures are only trending slowly compared to cases, whichever way they're going).sheldrake wrote: Mon Oct 18, 2021 5:39 pm This is all qualitative and anecdotal. We must stick to hard data to make rational decisions.
What, hard data like a photo of an outdoors bar in July 2021?sheldrake wrote: Mon Oct 18, 2021 5:39 pm This is all qualitative and anecdotal. We must stick to hard data to make rational decisions.
Woah, this is really weird reasoning. You're suggesting that we shouldn't look at normal number of deaths per 100,000 adjusted by age cohort? Why would you do this?jimbob wrote: Mon Oct 18, 2021 6:40 pm
The thing about age-adjusted mortality is that it's a read herring. For the last 20 years, the fall in that has been pretty much offset by the rise in the population, so the weekly number of deaths has been remarkably constant.
I haven't put these corrections, the ONS has. Ignoring age-adjustment in mortality is a really odd thing to do when you know your population is, on balance, getting older. It's an odd thing to just look at absolute numbers when you know your population is getting larger.I am not an actuary, so I don't try to reinvent the wheel. Putting in corrections where you don't understand them is silly.
Link me to an actuarial analysis if you believe that this profession has a different view, please.If you want an actuarial analysis - look at what actuaries are saying.
But you don't need to.
It seems like you don't believe age-adjustment matters when comparing mortality across years in an aging population? I just find that weird if so.Because it is so massive that you need to do really stupid fudges to pretend it's not a huge problem. I have seen quite a few of those.
Yes, mixed in with other data it's a pretty straightfoward way of highlighting how different the restrictions were in Sweden compared to the UK. You're not disputing this, are you ?
https://twitter.com/NickStripe_ONS/stat ... 32544?s=20sheldrake wrote: Mon Oct 18, 2021 6:50 pm
Link me to an actuarial analysis if you believe that this profession has a different view, please.
In this first thread, the author starts using recent post-2015 data (already covered problems with this) then gets as far as population-adjusting the data This makes the increase in deaths look much smaller on a long scale like so: -
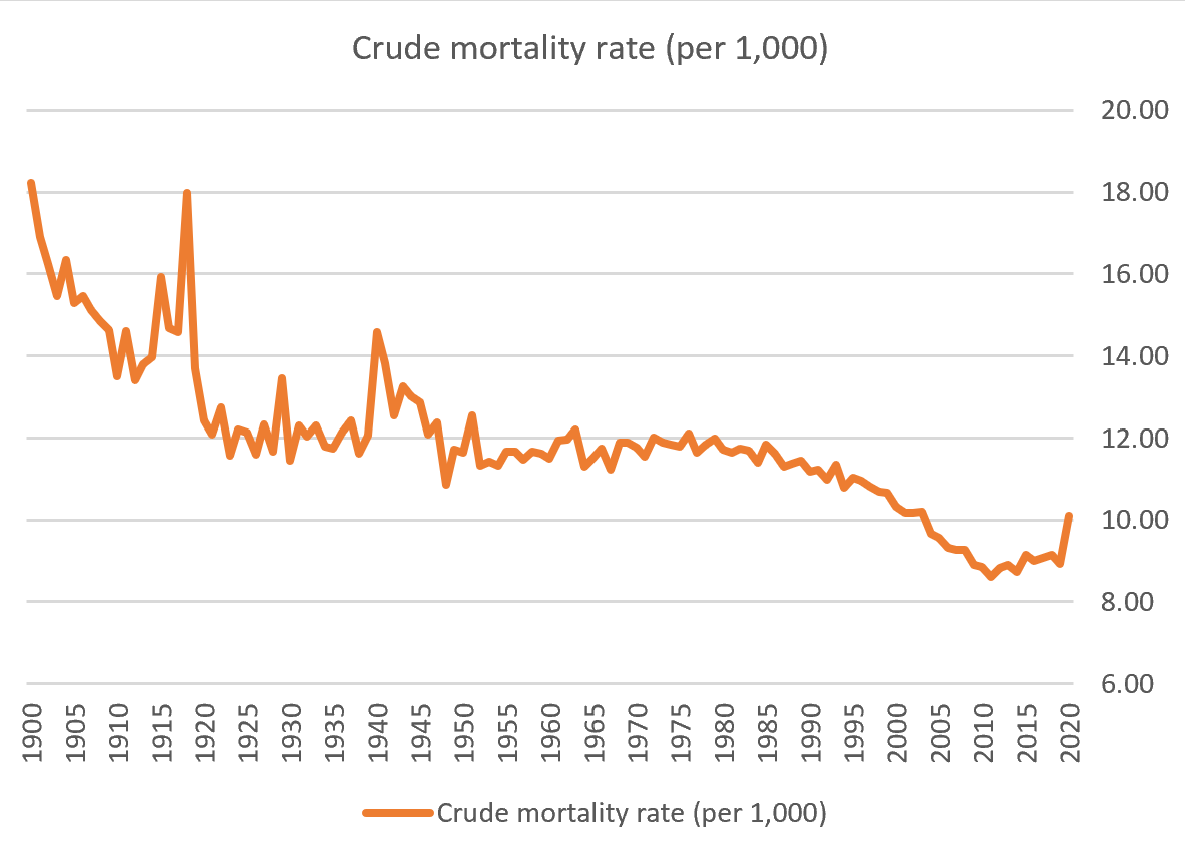
This is wrong https://commonslibrary.parliament.uk/re ... n%20people.Whilst the UK-born population is ageing, with post-war baby boomers now in their 50’s to 70’s, recent immigration will have predominantly been younger
sheldrake wrote: Mon Oct 18, 2021 7:16 pm If he'd have continued to do the analysis properly he would've gotten to the ONS data I already posted.
Sounds like he was planning to at the time of writing. Looks like he got there. For the ONS and everything.ONS dude wrote:We will produce age standardised rates soon
Then what was the point?
Because the age related data is not the only data of interest.
What is the interesting data?monkey wrote: Mon Oct 18, 2021 7:41 pm
Because the age related data is not the only data of interest.
I have plotted the raw numbers and given you the source of my data.sheldrake wrote: Mon Oct 18, 2021 7:18 pm The second twitter thread uses data only as far back as 2011. Neither of your sources demonstrates a good counter argument.
But you're segueing back and forth between age-adjusted data, population-only or unadjusted data. If we look at age-adjusted data, we returned to 2009 norms with a spike above the 5 year trend that looks simillar to 1951 flu.jimbob wrote: Mon Oct 18, 2021 7:44 pm
I have plotted the raw numbers and given you the source of my data.
Others have given Euromomo data.