I think a lot of schools are getting round this by openly saying they’ll be turning a blind eye towards unauthorised absence next week. Pointing out that any bubble that bursts next week will be isolating over Christmas will help keep numbers down too.mediocrity511 wrote: Sat Dec 12, 2020 7:52 amWhat English schools have been offered is the ability to move an INSET day at short notice. So staff still have to be in and it means they need to move a day from elsewhere in the calendar.raven wrote: Sat Dec 12, 2020 12:24 amI think English schools are getting to close a measly day early for Christmas. Apparently so headteachers don't have to do contact tracing on Christmas day itself. Just right up to it. Because they don't need a break from the stress at all...mediocrity511 wrote: Thu Dec 10, 2020 5:46 pm Wales have put their secondary schools online for the last week of term.
(My sister works in a primary. Staff were all hoping they'd shut a week early, because a) it would seem quite sensible given the circumstances and b)they suspect a fair few parents will take their kids out that last week anyway so that they can isolate before seeing Granny at Christmas. No such luck for the poor staff who will have to go in to the bitter end.)
I was tempted to take Miniocrity out to avoid being made to isolate over Christmas. But instead, we've negotiated an authorised absence for the first week back, to try and protect Mr Mediocrity from any rise caused by Christmas mixing.
Also schools that tried to move to online learning for the last week have been threatened with court action by the DfE.
COVID-19
-
OffTheRock
- Fuzzable
- Posts: 272
- Joined: Mon Dec 02, 2019 6:52 pm
Re: COVID-19
-
Trinucleus

- Dorkwood
- Posts: 1065
- Joined: Mon Nov 11, 2019 6:45 pm
Re: COVID-19
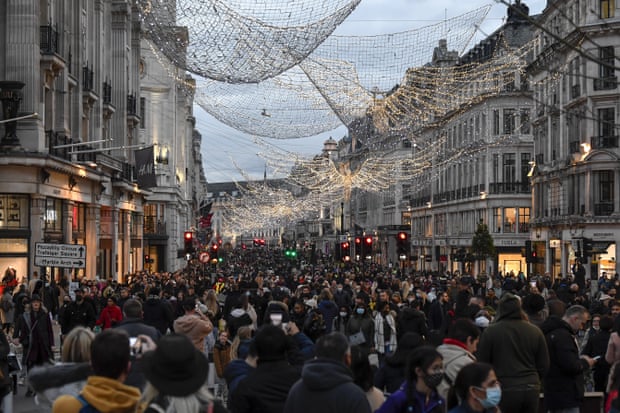
shpalman wrote: Sat Dec 12, 2020 7:10 pm london-is-f.cked.png
Scores of shoppers flocked to central London on the second-to-last weekend before Christmas.
Regent Street, one of the British capital’s busiest shopping streets, has been pedestrianised in the lead-up to Christmas to encourage more shopping and safe distances.
It comes as British health secretary, Matt Hancock, said it is “not inevitable” that London will be placed under tighter coronavirus restrictions ahead of next week’s review of the three-tier system in England.
If London goes into Tier 3 of course the Government will say ' it's what we need to do, deal with it'
just like areas in the north have had to for the last three months
-
mediocrity511

- Snowbonk
- Posts: 409
- Joined: Mon Nov 11, 2019 2:16 pm
Re: COVID-19
Which is an inequitable solution. I'd be very interested to see the demographics of the schools taking that approach, because my suspicion is that only schools without any significant truancy issues will have the confidence to take that route. Any schools that has truancy issues or has had real problems getting vulnerable children back into school post lockdown is unlikely to be able to send out a message saying that unauthorised absence is ok and no big deal.OffTheRock wrote: Sat Dec 12, 2020 7:43 pmI think a lot of schools are getting round this by openly saying they’ll be turning a blind eye towards unauthorised absence next week. Pointing out that any bubble that bursts next week will be isolating over Christmas will help keep numbers down too.mediocrity511 wrote: Sat Dec 12, 2020 7:52 amWhat English schools have been offered is the ability to move an INSET day at short notice. So staff still have to be in and it means they need to move a day from elsewhere in the calendar.raven wrote: Sat Dec 12, 2020 12:24 am
I think English schools are getting to close a measly day early for Christmas. Apparently so headteachers don't have to do contact tracing on Christmas day itself. Just right up to it. Because they don't need a break from the stress at all...
(My sister works in a primary. Staff were all hoping they'd shut a week early, because a) it would seem quite sensible given the circumstances and b)they suspect a fair few parents will take their kids out that last week anyway so that they can isolate before seeing Granny at Christmas. No such luck for the poor staff who will have to go in to the bitter end.)
I was tempted to take Miniocrity out to avoid being made to isolate over Christmas. But instead, we've negotiated an authorised absence for the first week back, to try and protect Mr Mediocrity from any rise caused by Christmas mixing.
Also schools that tried to move to online learning for the last week have been threatened with court action by the DfE.
And of course private schools are exempt from the legal threats.
Every part of this situation just entrenches inequality. In schools most definitely, but more broadly through the whole of society.
-
bolo

- Dorkwood
- Posts: 1084
- Joined: Mon Nov 11, 2019 1:17 pm
- Location: Washington DC
Re: COVID-19
That Regent Street picture is amazing. How can so many of them be wearing masks? If you have enough sense to wear a mask, how can you not have enough sense to avoid Regent Street?
-
OffTheRock
- Fuzzable
- Posts: 272
- Joined: Mon Dec 02, 2019 6:52 pm
Re: COVID-19
It is inéquitable but I think they are resigned to the fact that large numbers of parents aren’t sending their kids in for the last week. It’s going to end up looking like that week before lockdown in March when attendance was horrific. Threatening to fine the 50% of parents that are keeping their kids off isn’t going to make a difference.
I think most were planning to go online but the DfE seem determined to close that route down in an attempt to say they’ve kept schools open all term.
I think most were planning to go online but the DfE seem determined to close that route down in an attempt to say they’ve kept schools open all term.
-
raven
- Catbabel
- Posts: 653
- Joined: Mon Nov 11, 2019 8:58 pm
Re: COVID-19
I was thinking that schools closing a week early might allow for a bit of brake on numbers before the inevitable Christmas mixing boosts them again, but that would depend on the majority of people sensibly using that time to self-isolate before visiting Granny.
That doesn't seem so likely after that picture.
That doesn't seem so likely after that picture.
-
jimbob

- Light of Blast
- Posts: 5793
- Joined: Mon Nov 11, 2019 4:04 pm
- Location: High Peak/Manchester
Re: COVID-19
Because, some only getto the first 4 words of "masks do reduce risk especially for others but not as much as not being there" ?bolo wrote: Sat Dec 12, 2020 11:19 pm That Regent Street picture is amazing. How can so many of them be wearing masks? If you have enough sense to wear a mask, how can you not have enough sense to avoid Regent Street?
Have you considered stupidity as an explanation
-
shpalman

- Princess POW
- Posts: 8721
- Joined: Mon Nov 11, 2019 12:53 pm
- Location: One step beyond
- Contact:
Re: COVID-19
To be fair, if people are walking around outside wearing masks and it's not an actual crowd then there's probably not a high chance of contagion - you never spend that long next to any particular person.jimbob wrote: Sun Dec 13, 2020 9:00 amBecause, some only getto the first 4 words of "masks do reduce risk especially for others but not as much as not being there" ?bolo wrote: Sat Dec 12, 2020 11:19 pm That Regent Street picture is amazing. How can so many of them be wearing masks? If you have enough sense to wear a mask, how can you not have enough sense to avoid Regent Street?
Shops would be a different problem.
And at least they're wearing masks.
having that swing is a necessary but not sufficient condition for it meaning a thing
@shpalman@mastodon.me.uk
@shpalman.bsky.social / bsky.app/profile/chrastina.net
threads.net/@dannychrastina
@shpalman@mastodon.me.uk
@shpalman.bsky.social / bsky.app/profile/chrastina.net
threads.net/@dannychrastina
-
headshot

- After Pie
- Posts: 1658
- Joined: Tue Nov 12, 2019 9:40 am
Re: COVID-19
Also, it’s a low angle shot. The gaps between people were probably much larger than appear in the photo.shpalman wrote: Sun Dec 13, 2020 10:10 amTo be fair, if people are walking around outside wearing masks and it's not an actual crowd then there's probably not a high chance of contagion - you never spend that long next to any particular person.jimbob wrote: Sun Dec 13, 2020 9:00 amBecause, some only getto the first 4 words of "masks do reduce risk especially for others but not as much as not being there" ?bolo wrote: Sat Dec 12, 2020 11:19 pm That Regent Street picture is amazing. How can so many of them be wearing masks? If you have enough sense to wear a mask, how can you not have enough sense to avoid Regent Street?
Shops would be a different problem.
And at least they're wearing masks.
-
lpm

- Junior Mod
- Posts: 6480
- Joined: Mon Nov 11, 2019 1:05 pm
Re: COVID-19
Obviously there's no formal definition, but some people say "we're risking a third wave" and I just see it as a continuation of the second.
I'd put the end point of the first wave at either the case minimum or the death minimum. Deaths were lowest at about 21 August which would mean the official death toll of the first wave was 41,491. Picking a different day in July or August doesn't make much difference.
I think 21 August is a good point to pick for the start of the second wave because the government was bringing together all ingredients around then. There was Eat Out to Help Covid Out, schools in Scotland had restarted, the government was urging people to head to airports, and all the slice-by-slice unlockdowning was done. Soon it was to be joined by England's schools in early September and then universities and we were off and running up that curve.
I don't think we should call anything a third wave because the current upswing in the numbers is just a continuation of the underlying factors of the second wave. There's no shift in policies.
This gives official deaths of 41,491 in the first wave and 22,632 in the second so far, for a total of 64,123. Without the vaccine we are locked into at least 50,000 killed by the second wave - lower peak than the first, but lasting for a lot longer. I think the vaccine should at the very least prevent us going beyond this level. Obviously excess deaths will exceed the official statistics.
 Awarded gold star 4 November 2021
-
jimbob
- Light of Blast
- Posts: 5793
- Joined: Mon Nov 11, 2019 4:04 pm
- Location: High Peak/Manchester
Re: COVID-19
All that's true - there was a viral photo of a queue from two angles earlier on highlighting this, but... you don't go shopping in Regent Street and not enter shops.shpalman wrote: Sun Dec 13, 2020 10:10 amTo be fair, if people are walking around outside wearing masks and it's not an actual crowd then there's probably not a high chance of contagion - you never spend that long next to any particular person.jimbob wrote: Sun Dec 13, 2020 9:00 amBecause, some only getto the first 4 words of "masks do reduce risk especially for others but not as much as not being there" ?bolo wrote: Sat Dec 12, 2020 11:19 pm That Regent Street picture is amazing. How can so many of them be wearing masks? If you have enough sense to wear a mask, how can you not have enough sense to avoid Regent Street?
Shops would be a different problem.
And at least they're wearing masks.
Have you considered stupidity as an explanation
-
jimbob
- Light of Blast
- Posts: 5793
- Joined: Mon Nov 11, 2019 4:04 pm
- Location: High Peak/Manchester
Re: COVID-19
And most would probably have used some form of public transport to get there - trains, busses, or underground.
Have you considered stupidity as an explanation
-
lpm
- Junior Mod
- Posts: 6480
- Joined: Mon Nov 11, 2019 1:05 pm
Re: COVID-19
My favourite thing at the moment is pubs/restaurants who set up an outdoor area. Obviously they need a roof to keep off the rain. Then they add side walls to keep out the wind. Put in heating and electric lights. Hang a few pictures to make it look nice, install speakers for background music...
Awarded gold star 4 November 2021-
AMS
- Snowbonk
- Posts: 466
- Joined: Mon Nov 11, 2019 11:14 pm
Re: COVID-19
"Keeping the wind out" is the most important detail here.lpm wrote: Sun Dec 13, 2020 11:00 am My favourite thing at the moment is pubs/restaurants who set up an outdoor area. Obviously they need a roof to keep off the rain. Then they add side walls to keep out the wind. Put in heating and electric lights. Hang a few pictures to make it look nice, install speakers for background music...
-
shpalman
- Princess POW
- Posts: 8721
- Joined: Mon Nov 11, 2019 12:53 pm
- Location: One step beyond
- Contact:
Re: COVID-19
Lombardy is a yellow zone as of today, and it was a nice day, so you can imagine everyone went into town.
This was taken at about 15:20.
To be fair, the narrow streets in the centre are usually almost impassable during the weekends in December.
This was taken at about 15:20.
To be fair, the narrow streets in the centre are usually almost impassable during the weekends in December.
You do not have the required permissions to view the files attached to this post.
having that swing is a necessary but not sufficient condition for it meaning a thing
@shpalman@mastodon.me.uk
@shpalman.bsky.social / bsky.app/profile/chrastina.net
threads.net/@dannychrastina
@shpalman@mastodon.me.uk
@shpalman.bsky.social / bsky.app/profile/chrastina.net
threads.net/@dannychrastina
-
KAJ
- Fuzzable
- Posts: 313
- Joined: Thu Nov 14, 2019 5:05 pm
- Location: UK
Re: COVID-19
shpalman wrote: Fri Dec 11, 2020 10:12 pm Yeah I'm specifically talking about whether it's more likely for a bunch of cases to finally get around to being reported on a certain day of the week rather than another one. Numbers of tests done each day is a different issue.
The lag between an event (death or positive test specimen) and its publication may be relevant to these questions.sTeamTraen wrote: Sat Dec 12, 2020 7:02 pm Here are the percentage of cases (left) / deaths (right) announced per day of the week for the past 39 weeks (since which daily cases have not dropped below 300, except for 29 July when only 70 were reported as 70 because, I think, the figures for England were missing and were caught up the next day).
I don't know what the cutoff time is for reporting, so to what extent data reported at around 1600-1700 UK time on any given day includes events that took place that day versus the day before, but I imagine that the lower number of deaths reported on Sunday and Monday corresponds to fewer death certificates being written on Saturdays and Sundays.Code: Select all
Monday      12.29    8.38
Tuesday     13.36   19.15
Wednesday   15.27   18.15
Thursday    16.08   15.76
Friday      15.15   16.68
Saturday    14.23   14.13
Sunday      13.63    7.74
Both of the figures for Saturdays are remarkably close to one-seventh.
Since 17 November I've been saving published data on 'Cases by Specimen Date' and 'Deaths by Date of Death'. One would expect these to rise with publication date until they reach a maximum, which is broadly what we see. (I've restricted events to those with a sufficient number of publication dates that I can reasonably(?) equate maximum with final value).
You do not have the required permissions to view the files attached to this post.
-
KAJ
- Fuzzable
- Posts: 313
- Joined: Thu Nov 14, 2019 5:05 pm
- Location: UK
Re: COVID-19
Todays coronavirus.data.gov.uk data reports 18447 new cases compared to 17272 last Sunday and 12155 the Sunday before.
This is what it looks like plotted by specimen date. I've started fitting a cubic rather than quadratic to allow for an upturn. (I'm not using the regression to predict or infer anything, just as a description of the data.)
There's no substantial effect of the cubic term. But note the zero weighted terms (those marked as incomplete by .gov.uk) are all above the fitted line, and can only be expected to rise as they become complete. If I include them in the regression I get this:
My conclusion? The "third wave" has started.
This is what it looks like plotted by specimen date. I've started fitting a cubic rather than quadratic to allow for an upturn. (I'm not using the regression to predict or infer anything, just as a description of the data.)
Code: Select all
Coefficients:
               Estimate Std. Error t value Pr(>|t|)
(Intercept)     9.52101    0.03472 274.192  < 2e-16 ***
poly(date, 3)1 -0.85152    0.12694  -6.708 2.06e-08 ***
poly(date, 3)2 -1.19036    0.13296  -8.953 8.32e-12 ***
poly(date, 3)3  0.42291    0.12829   3.296  0.00185 **
dayMon          0.52701    0.04781  11.022 9.51e-15 ***
dayTue          0.42403    0.04786   8.860 1.14e-11 ***
dayWed          0.40681    0.04793   8.487 4.09e-11 ***
dayThu          0.33277    0.04804   6.927 9.51e-09 ***
dayFri          0.31694    0.04659   6.802 1.48e-08 ***
daySat          0.05848    0.04668   1.253  0.21638
---
Signif. codes:  0 ‘***’ 0.001 ‘**’ 0.01 ‘*’ 0.05 ‘.’ 0.1 ‘ ’ 1

Residual standard error: 0.0956 on 48 degrees of freedom
Multiple R-squared: 0.8937, Adjusted R-squared: 0.8737 Code: Select all
Coefficients:
               Estimate Std. Error t value Pr(>|t|)
(Intercept)     9.56023    0.03559 268.622  < 2e-16 ***
poly(date, 3)1 -0.60248    0.10736  -5.612 7.45e-07 ***
poly(date, 3)2 -0.92934    0.10670  -8.710 8.36e-12 ***
poly(date, 3)3  0.64213    0.10822   5.934 2.31e-07 ***
dayMon          0.51605    0.05031  10.257 3.44e-14 ***
dayTue          0.41734    0.05037   8.286 3.92e-11 ***
dayWed          0.39701    0.05046   7.868 1.82e-10 ***
dayThu          0.28322    0.05059   5.598 7.83e-07 ***
dayFri          0.28927    0.05037   5.743 4.63e-07 ***
daySat          0.02727    0.05031   0.542     0.59
---
Signif. codes:  0 ‘***’ 0.001 ‘**’ 0.01 ‘*’ 0.05 ‘.’ 0.1 ‘ ’ 1

Residual standard error: 0.1067 on 53 degrees of freedom
Multiple R-squared:  0.862,	Adjusted R-squared:  0.8385
F-statistic: 36.78 on 9 and 53 DF, p-value: < 2.2e-16You do not have the required permissions to view the files attached to this post.
-
sTeamTraen

- Stummy Beige
- Posts: 2624
- Joined: Mon Nov 11, 2019 4:24 pm
- Location: Palma de Mallorca, Spain
Re: COVID-19
We can have a semantic (taxonomic?) fight about whether the second ever ended.
Something something hammer something something nail
-
KAJ
- Fuzzable
- Posts: 313
- Joined: Thu Nov 14, 2019 5:05 pm
- Location: UK
Re: COVID-19
I've been musing on what might be behind the strong dependence of 'Cases by Specimen Date' on day of week. I surmised that it was due to the dependence of number of tests on day of week.
If that were the principal cause then Cases/Tests should show a lesser dependence. But it doesn't  Anyone got any suggestions I might investigate?
Code: Select all
Response: log(Tests)
          Df  Sum Sq  Mean Sq F value    Pr(>F)
date       1 0.11949 0.119486  15.117 0.0002745 ***
day        6 1.51555 0.252591  31.956 3.068e-16 ***
Residuals 55 0.43474 0.007904
---
Signif. codes:  0 ‘***’ 0.001 ‘**’ 0.01 ‘*’ 0.05 ‘.’ 0.1 ‘ ’ 1

Coefficients:
              Estimate Std. Error t value Pr(>|t|)
(Intercept) -2.968e+01  1.151e+01  -2.579 0.012630 *
date         2.267e-03  6.197e-04   3.658 0.000570 ***
dayMon      -1.870e-01  4.192e-02  -4.461 4.08e-05 ***
dayTue       7.441e-02  4.193e-02   1.775 0.081505 .
dayWed       2.172e-01  4.195e-02   5.177 3.28e-06 ***
dayThu       2.915e-01  4.198e-02   6.943 4.67e-09 ***
dayFri       2.466e-01  4.193e-02   5.882 2.49e-07 ***
daySat       1.739e-01  4.192e-02   4.148 0.000117 ***
---
Signif. codes:  0 ‘***’ 0.001 ‘**’ 0.01 ‘*’ 0.05 ‘.’ 0.1 ‘ ’ 1

Residual standard error: 0.08891 on 55 degrees of freedom
Multiple R-squared:   0.79,	Adjusted R-squared:  0.7632
F-statistic: 29.55 on 7 and 55 DF,  p-value: < 2.2e-16
Code: Select all
Coefficients:
               Estimate Std. Error t value Pr(>|t|)
(Intercept)    -2.91147    0.03966 -73.405  < 2e-16 ***
poly(date, 3)1 -1.15206    0.14499  -7.946 2.66e-10 ***
poly(date, 3)2 -1.03964    0.15187  -6.846 1.27e-08 ***
poly(date, 3)3  0.37462    0.14654   2.556 0.013792 *
dayMon          0.70967    0.05461  12.994  < 2e-16 ***
dayTue          0.35254    0.05467   6.449 5.15e-08 ***
dayWed          0.20289    0.05475   3.706 0.000545 ***
dayThu          0.05377    0.05487   0.980 0.332018
dayFri          0.07040    0.05322   1.323 0.192177
daySat         -0.11463    0.05333  -2.150 0.036652 *
---
Signif. codes:  0 ‘***’ 0.001 ‘**’ 0.01 ‘*’ 0.05 ‘.’ 0.1 ‘ ’ 1

Residual standard error: 0.1092 on 48 degrees of freedom
Multiple R-squared:   0.91,	Adjusted R-squared:  0.8932
F-statistic: 53.96 on 9 and 48 DF, p-value: < 2.2e-16You do not have the required permissions to view the files attached to this post.
-
shpalman
- Princess POW
- Posts: 8721
- Joined: Mon Nov 11, 2019 12:53 pm
- Location: One step beyond
- Contact:
Re: COVID-19
Depends how it's handled if a swab is carried out on one day but processed the next day.
having that swing is a necessary but not sufficient condition for it meaning a thing
@shpalman@mastodon.me.uk
@shpalman.bsky.social / bsky.app/profile/chrastina.net
threads.net/@dannychrastina
@shpalman@mastodon.me.uk
@shpalman.bsky.social / bsky.app/profile/chrastina.net
threads.net/@dannychrastina
-
jimbob
- Light of Blast
- Posts: 5793
- Joined: Mon Nov 11, 2019 4:04 pm
- Location: High Peak/Manchester
Re: COVID-19
I think it depends on how the tests are handled. Hospital admissions, I guess would be less affected by weekends compared to drive in testing, so you might see a difference in the positivity ratio for the different types. Those isolating because of contacts might get tests but not hurry.KAJ wrote: Sun Dec 13, 2020 6:03 pm I've been musing on what might be behind the strong dependence of 'Cases by Specimen Date' on day of week. I surmised that it was due to the dependence of number of tests on day of week.
Tests.pngIf that were the principal cause then Cases/Tests should show a lesser dependence. But it doesn'tCode: Select all
Response: log(Tests)
          Df  Sum Sq  Mean Sq F value    Pr(>F)
date       1 0.11949 0.119486  15.117 0.0002745 ***
day        6 1.51555 0.252591  31.956 3.068e-16 ***
Residuals 55 0.43474 0.007904
---
Signif. codes:  0 ‘***’ 0.001 ‘**’ 0.01 ‘*’ 0.05 ‘.’ 0.1 ‘ ’ 1

Coefficients:
              Estimate Std. Error t value Pr(>|t|)
(Intercept) -2.968e+01  1.151e+01  -2.579 0.012630 *
date         2.267e-03  6.197e-04   3.658 0.000570 ***
dayMon      -1.870e-01  4.192e-02  -4.461 4.08e-05 ***
dayTue       7.441e-02  4.193e-02   1.775 0.081505 .
dayWed       2.172e-01  4.195e-02   5.177 3.28e-06 ***
dayThu       2.915e-01  4.198e-02   6.943 4.67e-09 ***
dayFri       2.466e-01  4.193e-02   5.882 2.49e-07 ***
daySat       1.739e-01  4.192e-02   4.148 0.000117 ***
---
Signif. codes:  0 ‘***’ 0.001 ‘**’ 0.01 ‘*’ 0.05 ‘.’ 0.1 ‘ ’ 1

Residual standard error: 0.08891 on 55 degrees of freedom
Multiple R-squared:   0.79,	Adjusted R-squared:  0.7632
F-statistic: 29.55 on 7 and 55 DF,  p-value: < 2.2e-16
Cases.Tests.pngAnyone got any suggestions I might investigate?Code: Select all
Coefficients:
               Estimate Std. Error t value Pr(>|t|)
(Intercept)    -2.91147    0.03966 -73.405  < 2e-16 ***
poly(date, 3)1 -1.15206    0.14499  -7.946 2.66e-10 ***
poly(date, 3)2 -1.03964    0.15187  -6.846 1.27e-08 ***
poly(date, 3)3  0.37462    0.14654   2.556 0.013792 *
dayMon          0.70967    0.05461  12.994  < 2e-16 ***
dayTue          0.35254    0.05467   6.449 5.15e-08 ***
dayWed          0.20289    0.05475   3.706 0.000545 ***
dayThu          0.05377    0.05487   0.980 0.332018
dayFri          0.07040    0.05322   1.323 0.192177
daySat         -0.11463    0.05333  -2.150 0.036652 *
---
Signif. codes:  0 ‘***’ 0.001 ‘**’ 0.01 ‘*’ 0.05 ‘.’ 0.1 ‘ ’ 1

Residual standard error: 0.1092 on 48 degrees of freedom
Multiple R-squared:   0.91,	Adjusted R-squared:  0.8932
F-statistic: 53.96 on 9 and 48 DF,  p-value: < 2.2e-16
I can see how those could swing it either way.
Meanwhile - this is my (far simpler) plot of the tests vs specimen date for each day of the week against week number.
It tells the same story as your more in-depth analysis - but I think the graph is easy to see.
You do not have the required permissions to view the files attached to this post.
Have you considered stupidity as an explanation
-
jimbob
- Light of Blast
- Posts: 5793
- Joined: Mon Nov 11, 2019 4:04 pm
- Location: High Peak/Manchester
-
sTeamTraen
- Stummy Beige
- Posts: 2624
- Joined: Mon Nov 11, 2019 4:24 pm
- Location: Palma de Mallorca, Spain
Re: COVID-19
I wouldn't feel especially unsafe in that situation. Outdoors, 100% masks, minimal time spent in contact with any other person. We've been living like that for 6 months, including occasional visits to (large, high-ceilinged) indoor shopping centres. It does help that neither Mrs sTeamTraen nor I are great consumers of stuff in general --- we have both hardly been into any small shops the whole time.shpalman wrote: Sun Dec 13, 2020 5:00 pm Lombardy is a yellow zone as of today, and it was a nice day, so you can imagine everyone went into town.
This was taken at about 15:20.
To be fair, the narrow streets in the centre are usually almost impassable during the weekends in December.
Relatedly: A dirty little secret of COVID is that people with pensions or tenured government jobs have probably saved quite a bit of money. Rishi Sunak got stick for suggesting that public sector workers might need to make some sort of financial contribution to the recovery, which predictably got diverted into the entirely reasonable question of pay for NHS staff, but most of us comfortably retired types and/or better-paid local council workers could probably afford to give up some of what we haven't spent of meals out and fancy travel this year. I feel very bad for the self-employed, in particular, who have been let down by the furlough schemes (in many countries, not just the UK).
Something something hammer something something nail
-
lpm
- Junior Mod
- Posts: 6480
- Joined: Mon Nov 11, 2019 1:05 pm
Re: COVID-19
Thanks KAJ. Very useful.
I think it shows the first week of lockdown was slower than it should to take effect and the final week was rising before the official end date.
It's depressing. If I was to invent a narrative of would be arrogant Londoners not giving a sh.t about rules and going to restaurants together, like those idiot Sky journalists. But it's been similar in other regions and countries.
Awarded gold star 4 November 2021-
KAJ
- Fuzzable
- Posts: 313
- Joined: Thu Nov 14, 2019 5:05 pm
- Location: UK
Re: COVID-19
Good point. "Cases by specimen date" is clearly(?) by the date the swab is carried out.shpalman wrote: Sun Dec 13, 2020 6:37 pm Depends how it's handled if a swab is carried out on one day but processed the next day.
But I've been using Tests = "newPillarOneTwoTestsByPublishDate" which is by publish date, very often(?) later than specimen date.
In developers-guide#params-structure I don't see a metric for tests other than by publish date. On the other hand I don't see "newPillarOneTwoTestsByPublishDate" either, which I've been using for some time and must have picked up from coronavirus.data.gov.uk in the first place.
I guess the dates of cases by publish date may correspond to those of tests by publish date. Taking that ratio I get:
Code: Select all
Analysis of Variance Table

Response: log(Cases.Tests)
              Df  Sum Sq Mean Sq F value    Pr(>F)
poly(date, 3)  3 1.99814 0.66605  34.030  2.12e-12 ***
day            6 0.59199 0.09867   5.041 0.0003737 ***
Residuals     53 1.03734 0.01957
---
Signif. codes:  0 ‘***’ 0.001 ‘**’ 0.01 ‘*’ 0.05 ‘.’ 0.1 ‘ ’ 1

Coefficients:
               Estimate Std. Error t value Pr(>|t|)
(Intercept)    -2.63043    0.04667 -56.365  < 2e-16 ***
poly(date, 3)1 -0.76742    0.14078  -5.451 1.33e-06 ***
poly(date, 3)2 -1.08763    0.13991  -7.774 2.58e-10 ***
poly(date, 3)3  0.46106    0.14190   3.249  0.00201 **
dayMon          0.13816    0.06597   2.094  0.04105 *
dayTue         -0.12832    0.06605  -1.943  0.05735 .
dayWed         -0.08010    0.06617  -1.211  0.23140
dayThu         -0.12394    0.06634  -1.868  0.06725 .
dayFri         -0.17354    0.06605  -2.627  0.01123 *
daySat         -0.09323    0.06597  -1.413  0.16347
---
Signif. codes:  0 ‘***’ 0.001 ‘**’ 0.01 ‘*’ 0.05 ‘.’ 0.1 ‘ ’ 1

Residual standard error: 0.1399 on 53 degrees of freedom
Multiple R-squared:  0.714,	Adjusted R-squared:  0.6655
F-statistic:  14.7 on 9 and 53 DF,  p-value: 1.385e-11
Code: Select all
Analysis of Variance Table

Response: log(PubCases)
              Df  Sum Sq Mean Sq F value   Pr(>F)
poly(date, 3)  3 1.71301 0.57100 28.4255  4.3e-11 ***
day            6 0.39217 0.06536  3.2538 0.008492 **
Residuals     53 1.06465 0.02009
---
Signif. codes:  0 ‘***’ 0.001 ‘**’ 0.01 ‘*’ 0.05 ‘.’ 0.1 ‘ ’ 1

Coefficients:
               Estimate Std. Error t value Pr(>|t|)
(Intercept)     9.81603    0.04756 206.393  < 2e-16 ***
poly(date, 3)1 -0.53409    0.14262  -3.745 0.000446 ***
poly(date, 3)2 -0.85512    0.14174  -6.033 1.60e-07 ***
poly(date, 3)3  0.79031    0.14376   5.498 1.13e-06 ***
dayMon         -0.05330    0.06684  -0.797 0.428773
dayTue         -0.06282    0.06692  -0.939 0.352065
dayWed          0.12376    0.06704   1.846 0.070454 .
dayThu          0.14975    0.06721   2.228 0.030135 *
dayFri          0.09062    0.06743   1.344 0.184700
daySat          0.08855    0.06770   1.308 0.196555
---
Signif. codes:  0 ‘***’ 0.001 ‘**’ 0.01 ‘*’ 0.05 ‘.’ 0.1 ‘ ’ 1

Residual standard error: 0.1417 on 53 degrees of freedom
Multiple R-squared:  0.6641,	Adjusted R-squared:  0.6071
F-statistic: 11.64 on 9 and 53 DF, p-value: 7.734e-10You do not have the required permissions to view the files attached to this post.