My trips to shops or on trains seem to show mask wearing varying widely from 40% to 80% with no obvious explanation for why some days are worse/better than others.
I am noticing an almost 100% correlation between people who don’t wear masks and people who don’t watch where they are walking though. I’m getting a little fed up of jumping out the way every time. I may just stay the course and watch them bounce off.
Nah probably won’t. Don’t give a sh.t about them but I would like to avoid infecting my loved ones if I can (not too worried about myself now I’ve been vaxed although I’d still obviously rather not get it).
COVID-19
-
Stranger Mouse

- Stummy Beige
- Posts: 3085
- Joined: Sat Dec 21, 2019 1:23 pm
Re: COVID-19
Sanctuary f.cking Moon?
-
shpalman

- Princess POW
- Posts: 8719
- Joined: Mon Nov 11, 2019 12:53 pm
- Location: One step beyond
- Contact:
Re: COVID-19
Not-reviewed-yet preprint on virological and serological kinetics of SARS-CoV-2 Delta variant vaccine-breakthrough infections.
So for the first few days it's the same* but then in vaccinated subjects it decreases faster.
(Ct is the cycle threshold, so the y-axis is basically a logarithmic scale of how much DNA there is with lower numbers meaning more.)
* - vaccinated people would be less likely to catch it in the first place of course.
You do not have the required permissions to view the files attached to this post.
having that swing is a necessary but not sufficient condition for it meaning a thing
@shpalman@mastodon.me.uk
@shpalman.bsky.social / bsky.app/profile/chrastina.net
threads.net/@dannychrastina
@shpalman@mastodon.me.uk
@shpalman.bsky.social / bsky.app/profile/chrastina.net
threads.net/@dannychrastina
-
wilsontown

- Clardic Fug
- Posts: 232
- Joined: Tue Feb 23, 2021 11:51 am
Re: COVID-19
The 7-day case average increased slightly today for the first time since mid July. But it does look like there is something real about the fall in cases as hospital admissions are down.
"All models are wrong but some are useful" - George Box
-
KAJ
- Fuzzable
- Posts: 313
- Joined: Thu Nov 14, 2019 5:05 pm
- Location: UK
Re: COVID-19
Here's my routine plot of cases by specimen date (the blue line is: ## `geom_smooth()` using method = 'loess' and formula 'y ~ x', maybe best ignored).wilsontown wrote: Wed Aug 04, 2021 4:18 pm The 7-day case average increased slightly today for the first time since mid July. But it does look like there is something real about the fall in cases as hospital admissions are down.
(Please let's avoid going down the plot details rabbit hole, this plot is really only intended for me. The data is at coronavirus.data.gov.uk if you prefer another analysis or presentation.) Latest 5 data are zero weighted as being "incomplete". The fit is pretty good...
Code: Select all
Coefficients:
               Estimate Std. Error t value Pr(>|t|)
(Intercept)     9.94467    0.05679 175.100  < 2e-16 ***
poly(date, 2)1  1.38921    0.18125   7.665 7.98e-09 ***
poly(date, 2)2 -2.38207    0.18216 -13.077 1.32e-14 ***
dayMon          0.34040    0.07936   4.289 0.000147 ***
dayTue          0.31559    0.07942   3.974 0.000363 ***
dayWed          0.33296    0.07953   4.186 0.000198 ***
dayThu          0.29790    0.07953   3.746 0.000688 ***
dayFri          0.18649    0.07942   2.348 0.025016 *
daySat         -0.02750    0.07936  -0.347 0.731140
---
Signif. codes:  0 ‘***’ 0.001 ‘**’ 0.01 ‘*’ 0.05 ‘.’ 0.1 ‘ ’ 1

Residual standard error: 0.1374 on 33 degrees of freedom
Multiple R-squared: 0.9303I find the residuals plot suggestive... In the week after the Euros case numbers were substantially above the fitted curve, then went below, now are increasingly above again - even the latest 5 data which will probably be increased.
I also see hospital admissions decreasing... ... but I fear that may be a decrease from a post-Euros peak to be followed by an increase to "underlying" trends (whatever that means!).
You do not have the required permissions to view the files attached to this post.
-
Herainestold
- After Pie
- Posts: 2029
- Joined: Mon Nov 25, 2019 1:23 pm
Re: COVID-19
This what I have been fearing.wilsontown wrote: Wed Aug 04, 2021 4:18 pm The 7-day case average increased slightly today for the first time since mid July. But it does look like there is something real about the fall in cases as hospital admissions are down.
Masking forever
Putin is a monster.
Russian socialism will rise again
Putin is a monster.
Russian socialism will rise again
-
Woodchopper

- Princess POW
- Posts: 7515
- Joined: Sat Oct 12, 2019 9:05 am
Re: COVID-19
Illness duration and symptom profile in symptomatic UK school-aged children tested for SARS-CoV-2
https://www.thelancet.com/journals/lanc ... X/fulltext
https://www.thelancet.com/journals/lanc ... X/fulltext
-
wilsontown
- Clardic Fug
- Posts: 232
- Joined: Tue Feb 23, 2021 11:51 am
Re: COVID-19
The usual plot of daily change in the 7 day case average:
You do not have the required permissions to view the files attached to this post.
"All models are wrong but some are useful" - George Box
-
shpalman
- Princess POW
- Posts: 8719
- Joined: Mon Nov 11, 2019 12:53 pm
- Location: One step beyond
- Contact:
Re: COVID-19
Admissions may have peaked but deaths (three week lag, 0.3% CFR) are probably going to go up to match the case peak you had.
You do not have the required permissions to view the files attached to this post.
having that swing is a necessary but not sufficient condition for it meaning a thing
@shpalman@mastodon.me.uk
@shpalman.bsky.social / bsky.app/profile/chrastina.net
threads.net/@dannychrastina
@shpalman@mastodon.me.uk
@shpalman.bsky.social / bsky.app/profile/chrastina.net
threads.net/@dannychrastina
-
shpalman
- Princess POW
- Posts: 8719
- Joined: Mon Nov 11, 2019 12:53 pm
- Location: One step beyond
- Contact:
Re: COVID-19
More than one-fifth of people admitted to hospital with Covid-19 are aged between 18 and 34...
The peak of the winter wave in January had about 34,000 patients in hospital in England in total (5.4% of 34,000 is 1840) while you had about 5,000 patients in hospital in total at the peak a few days ago ("more than 20%" of 5,000 is "more than 1000").the proportion of patients aged 18-34 in hospital had nearly quadrupled from 5.4% at the peak of the winter wave in January to reach more than 20% last month, with 5,000 seriously ill in hospital.
having that swing is a necessary but not sufficient condition for it meaning a thing
@shpalman@mastodon.me.uk
@shpalman.bsky.social / bsky.app/profile/chrastina.net
threads.net/@dannychrastina
@shpalman@mastodon.me.uk
@shpalman.bsky.social / bsky.app/profile/chrastina.net
threads.net/@dannychrastina
-
headshot

- After Pie
- Posts: 1655
- Joined: Tue Nov 12, 2019 9:40 am
Re: COVID-19
We need information on vaccination rates in those hospitalised...
-
jimbob

- Light of Blast
- Posts: 5785
- Joined: Mon Nov 11, 2019 4:04 pm
- Location: High Peak/Manchester
Re: COVID-19
https://www.eurosurveillance.org/conten ... 31.2100707
It does look as though Scotland's football was responsible for their peak and their leaving the competition for it falling rather than school holidays being earlier in Scotland
It does look as though Scotland's football was responsible for their peak and their leaving the competition for it falling rather than school holidays being earlier in Scotland
Have you considered stupidity as an explanation
-
Woodchopper
- Princess POW
- Posts: 7515
- Joined: Sat Oct 12, 2019 9:05 am
Re: COVID-19
http://jogh.org/documents/2021/jogh-11-05013.pdf
Risk of infection and transmission of SARS- CoV-2 among children and adolescents in households, communities and educational settings: A systematic review and meta-analysis
Background
There is uncertainty with respect to SARS-CoV-2 transmission in children (0-19 years) with controversy on effectiveness of school-closures in controlling the pandemic. It is of equal importance to evaluate the risk of transmission in children who are often asymptomatic or mildly symptomatic carriers that may incidentally transmit SARS-CoV-2 in different settings. We conducted this review to assess transmission and risks for SARS-CoV-2 in children (by age- groups or grades) in community and educational-settings compared to adults.
Methods Data for the review were retrieved from PubMed, EMBASE, Cochrane Library, WHO COVID-19 Database, China National Knowledge Infrastructure (CNKI) Database, WanFang Database, Latin American and Caribbean Health Sciences Literature (LILACS), Google Schol- ar, and preprints from medRixv and bioRixv) covering a timeline from December 1, 2019 to April 1, 2021. Population-screening, contact-tracing and cohort studies reporting prevalence and transmission of SARS-CoV-2 in children were included. Data were extracted according to PRISMA guidelines. Meta-analyses were performed using Review Manager 5.3.
Results
Ninety studies were included. Compared to adults, children showed comparable national (risk ratio (RR)=0.87, 95% confidence interval (CI)=0.71-1.060 and subnational (RR=0.81, 95% CI=0.66-1.01) prevalence in population-screening studies, and lower odds of infection in community/household contact-tracing studies (odds ratio (OR)=0.62, 95% CI=0.46-0.84). On disaggregation, adolescents observed comparable risk (OR=1.22, 95% CI=0.74-2.04) with adults. In educational-settings, children attending daycare/preschools (OR=0.53, 95% CI=0.38-0.72) were observed to be at lower-risk when compared to adults, with odds of infection among primary (OR=0.85, 95% CI=0.55-1.31) and high-schoolers (OR=1.30, 95% CI=0.71-2.38) comparable to adults. Overall, children and adolescents had lower odds of infection in educational-settings compared to community and household clusters.
Conclusions
Children (<10 years) showed lower susceptibility to COVID-19 compared to adults, whereas adolescents in communities and high-schoolers had comparable risk. Risks of infection among children in educational-settings was lower than in communities. Evidence from school-based studies demonstrate it is largely safe for children (<10 years) to be at schools, however older children (10-19 years) might facilitate transmission. Despite this evidence, stud- ies focusing on the effectiveness of mitigation measures in educational settings are urgently needed to support both public health and educational policy-making for school reopening.
-
jimbob
- Light of Blast
- Posts: 5785
- Joined: Mon Nov 11, 2019 4:04 pm
- Location: High Peak/Manchester
Re: COVID-19
I couldn't think where this should go:
The antivax anti-lockdown HART group in the UK let anyone who registered see their rocket.int chats (the free version). They didn't realise this.
https://www.logically.ai/articles/hart- ... estminster
This is the one that really strikes me - from a different source to this article, which is only for background
Yes, they do refer to Covid as "the money tree"
You do not have the required permissions to view the files attached to this post.
Have you considered stupidity as an explanation
-
Woodchopper
- Princess POW
- Posts: 7515
- Joined: Sat Oct 12, 2019 9:05 am
Re: COVID-19
https://www.biorxiv.org/content/10.1101 ... 1.455984v1
Durability of SARS-CoV-2-specific T cell responses at 12-months post-infection
Results.
SARS-CoV-2-specific antibodies and T cells were detected at 12-months post-infection. Severity of acute illness was associated with higher frequencies of SARS-CoV-2-specific CD4 T cells and antibodies at 12-months. In contrast, polyfunctional and cytotoxic T cells responsive to SARS-CoV-2 were identified in participants over a wide spectrum of disease severity.
Conclusions.
Our data show that SARS-CoV-2 infection induces polyfunctional memory T cells detectable at 12-months post-infection, with higher frequency noted in those who originally experienced severe disease.
The immune system doing what it’s supposed to be doing.
-
shpalman
- Princess POW
- Posts: 8719
- Joined: Mon Nov 11, 2019 12:53 pm
- Location: One step beyond
- Contact:
Re: COVID-19
England’s R number between 0.8 and 1.0 based on last week when cases were coming down, which means that cases were coming down, except of course that they're obviously slowly going up again now as you can see by just looking at the data without needing to do any fancy analysis apart from assuming the testing rate is roughly constant.
having that swing is a necessary but not sufficient condition for it meaning a thing
@shpalman@mastodon.me.uk
@shpalman.bsky.social / bsky.app/profile/chrastina.net
threads.net/@dannychrastina
@shpalman@mastodon.me.uk
@shpalman.bsky.social / bsky.app/profile/chrastina.net
threads.net/@dannychrastina
-
jimbob
- Light of Blast
- Posts: 5785
- Joined: Mon Nov 11, 2019 4:04 pm
- Location: High Peak/Manchester
Re: COVID-19
Exactly, it's losing sight of what one uses R for. Given what we know about Covid spread (huge disparity in individual R compared to even other diseases) it's even more daft.shpalman wrote: Sat Aug 14, 2021 6:53 am England’s R number between 0.8 and 1.0 based on last week when cases were coming down, which means that cases were coming down, except of course that they're obviously slowly going up again now as you can see by just looking at the data without needing to do any fancy analysis apart from assuming the testing rate is roughly constant.
As we have been saying for a long time.
Spoiler:
Have you considered stupidity as an explanation
-
lpm

- Junior Mod
- Posts: 6480
- Joined: Mon Nov 11, 2019 1:05 pm
Re: COVID-19
R=0.9, R=1.1, it doesn't really matter. Fine tuning has always been a fantasy. When you're in the realm of doubling or halving over a month, you can stop watching daily or weekly figures.
What matters is R=1.3, when the trend becomes noticeable very quickly. Doubling time of 2 weeks and the acceleration starts to make a big difference.
The figures for Scotland are the ones to watch over the next couple of weeks - schools go back on Tues or Weds. Presumably it will restart the engine and fire up the heat map for <18s.
Then in England they're saying 1.7 million people will attend mass events this weekend. Probably weighted a bit towards the 18-30 group which are the lowest vaccine protection.
 Awarded gold star 4 November 2021
-
jimbob
- Light of Blast
- Posts: 5785
- Joined: Mon Nov 11, 2019 4:04 pm
- Location: High Peak/Manchester
Re: COVID-19
That's the point that I'm making and I think Shpalman is too. And if cases are increasing, it doesn't take much of a change to swap from 1.1 to 1.3.lpm wrote: Sat Aug 14, 2021 10:27 am R=0.9, R=1.1, it doesn't really matter. Fine tuning has always been a fantasy. When you're in the realm of doubling or halving over a month, you can stop watching daily or weekly figures.
What matters is R=1.3, when the trend becomes noticeable very quickly. Doubling time of 2 weeks and the acceleration starts to make a big difference.
The figures for Scotland are the ones to watch over the next couple of weeks - schools go back on Tues or Weds. Presumably it will restart the engine and fire up the heat map for <18s.
Then in England they're saying 1.7 million people will attend mass events this weekend. Probably weighted a bit towards the 18-30 group which are the lowest vaccine protection.
Slowly-increasing isn't very stable with something like Covid.
Have you considered stupidity as an explanation
-
lpm
- Junior Mod
- Posts: 6480
- Joined: Mon Nov 11, 2019 1:05 pm
-
shpalman
- Princess POW
- Posts: 8719
- Joined: Mon Nov 11, 2019 12:53 pm
- Location: One step beyond
- Contact:
Re: COVID-19
You get less warning that things are going to sh.t if you wait for the R number from two weeks ago to tell you.
Italy's "orange" level seemed roughly in equilibrium with the virus in the days before delta and before vaccination but it obviously wasn't stable and the extra delay in analysing the numbers doesn't help with that.
Italy's "orange" level seemed roughly in equilibrium with the virus in the days before delta and before vaccination but it obviously wasn't stable and the extra delay in analysing the numbers doesn't help with that.
having that swing is a necessary but not sufficient condition for it meaning a thing
@shpalman@mastodon.me.uk
@shpalman.bsky.social / bsky.app/profile/chrastina.net
threads.net/@dannychrastina
@shpalman@mastodon.me.uk
@shpalman.bsky.social / bsky.app/profile/chrastina.net
threads.net/@dannychrastina
-
KAJ
- Fuzzable
- Posts: 313
- Joined: Thu Nov 14, 2019 5:05 pm
- Location: UK
Re: COVID-19
Last 6 weeks "Virus tests conducted" from coronavirus.data.gov.uk (black line is regression fit, red is 7 day moving average).shpalman wrote: Sat Aug 14, 2021 6:53 am England’s R number between 0.8 and 1.0 based on last week when cases were coming down, which means that cases were coming down, except of course that they're obviously slowly going up again now as you can see by just looking at the data without needing to do any fancy analysis apart from assuming the testing rate is roughly constant.
You do not have the required permissions to view the files attached to this post.
-
raven
- Catbabel
- Posts: 653
- Joined: Mon Nov 11, 2019 8:58 pm
Re: COVID-19
Pretty graphs... Case rates by age and region from Friday's PHE report, which goes up to 5th August. Cases in northeast coming down nicely, some increases everywhere else in 20-29 yr olds (yellow lines), but now schools are out no similar increases in 10-19yr olds (blue). Some rises in 30-39 yrolds too. So, basically, the age groups that have lower vaccination rates and/or think they're indestructible and are still socialising.
You do not have the required permissions to view the files attached to this post.
-
jimbob
- Light of Blast
- Posts: 5785
- Joined: Mon Nov 11, 2019 4:04 pm
- Location: High Peak/Manchester
Re: COVID-19
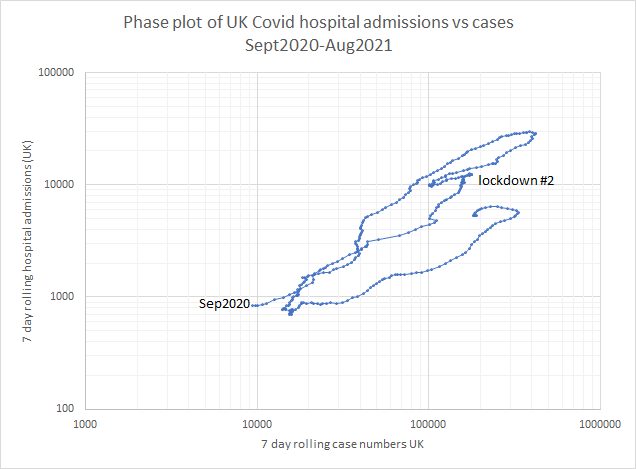
Latest version of my UK phase plot for rolling 7day hospital admissions against rolling 7day cases for the UK from September 2020
And the same just against time
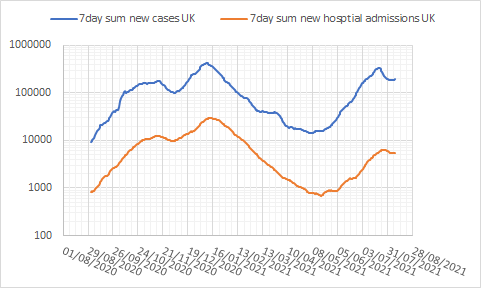
Have you considered stupidity as an explanation
-
jimbob
- Light of Blast
- Posts: 5785
- Joined: Mon Nov 11, 2019 4:04 pm
- Location: High Peak/Manchester
Re: COVID-19
Aside. I am still annoyed that they don't sort out their colours to make them more intuitive. There's a reason why I use the topographical one so that adjacent series have similar colours.raven wrote: Sat Aug 14, 2021 9:19 pm Pretty graphs... Case rates by age and region from Friday's PHE report, which goes up to 5th August. Cases in northeast coming down nicely, some increases everywhere else in 20-29 yr olds (yellow lines), but now schools are out no similar increases in 10-19yr olds (blue). Some rises in 30-39 yrolds too. So, basically, the age groups that have lower vaccination rates and/or think they're indestructible and are still socialising.
Screenshot 2021-08-14 at 21-25-30 PHE Influenza Surveillance graphs 5 August 2021 - Weekly_COVID-19_and_Influenza_Surveilla[...].png
Have you considered stupidity as an explanation
-
raven
- Catbabel
- Posts: 653
- Joined: Mon Nov 11, 2019 8:58 pm
Re: COVID-19
You're not the only one annoyed by that. (Why use two greens that are hard to tell apart?) MrRaven says it's probably because M$Office auto-selects rubbish colours.jimbob wrote: Sat Aug 14, 2021 9:20 pm Aside. I am still annoyed that they don't sort out their colours to make them more intuitive. There's a reason why I use the topographical one so that adjacent series have similar colours.